austinpop


About austinpop

Recent Profile Visitors
62067 profile views


-
Awesome! Will try it.
-
That would be great. I think over time, some of the hurdles to making this feasible will disappear. I consider ingress and egress to be one of the primary hurdles. Even if each instance is guaranteed 1Gbps (which is doubtful), there are several questions: Is bandwidth symmetric? 1Gbps ingress as well as egress? Hopefully yes. Will the PGGB use case trigger a claim of TOS violation by the cloud provider? Because between moving input files in, and output files out, you may be consuming your bandwidth allocation 24/7. This is a real concern, as I've seen many provides like Dropbox squawk when you start to consume a lot of bandwidth. Another excuse for providers to claim a TOS violation is that your traffic looks like a DDOS attack! Finally, many users are constrained by their upload bandwidth. I am one such, because fiber has not reached my area, so I have 960Mbps down, but only 20Mbps up. This alone makes using a cloud instance extremely painful. That said, some experimentation would be most helpful!
-
Very interesting. What egress speed is provided per instance by Hetzner?
-
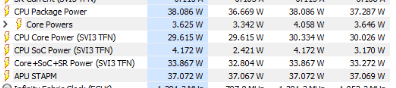
@taipan254 You collected excellent data, so this helps diagnose your issue. Based on what I see, you are indeed constrained by thermals. Note, you aren't thermal throttling (yet), but you are close to the limit, as you are running at 95C, just below the AMD TJMAX of 100C. This is evident from the snippets below. You can also see that your CPU is being driven to these temps at a package power of 38W, so in a sense, this explains why the processor frequency stepped down to below the base frequency. It also suggests this (around 35-40W) is the cooling capacity of your system. This correlates with the TDP rating of your CPU, which is: AMD Configurable TDP (cTDP): 35-54W To run at the turbo frequency of 5.2 GHz, your system would need to be able to dissipate ~55W, and it clearly can't. Light undervolting was a smart move, but this approach only takes you so far before your system becomes unstable. Since you are also running at 100% CPU, it's hard to see what more you can squeeze out of your system. So yes, if you are able, building or buying a desktop would give you a major boost in performance. We don't often get such good data and insights, so allow me to use your data to highlight why running PGGB on a laptop is almost never a good idea, except for occasional tracks or as a trial. Laptops are really not designed to be used for running long resource-intensive workloads that can stress the thermal capacity of the system. Rather, they are ideally suited to interactive workloads which, even if they stress the resources, do so in bursts. Modern CPUs can only run at or close to their turbo max frequencies at ever increasing wattage levels. For example, my i9-14900K cannot even achieve its turbo frequency of 5.7GHz at its rated TDP of 253W. Even my 4-year old i7-10700 needed to consume 170W to run at close to its turbo max frequency. Good luck finding a laptop whose case design is capable of dissipating that much heat. This is why a desktop system, equipped with robust cooling is far better suited for running PGGB. You need a well-ventilated case, and a top quality cooler, to dissipate the amount of heat today's processors produce when running full bore at their top frequencies for hours or days.

-
Hi @rayon It's all good, and I appreciate your efforts in digging into the root cause analysis. First, a mea culpa from me. @Zaphod Beeblebrox made me aware that for internal reasons having to do with how to make the code more scalable, 2FS/4FS/8FS input signals all get the same number of blocks. It's only 1FS (your use case) that gets double the blocks that 2FS and 4FS get. This would explain why my examples comparing 2FS and 4FS tracks showed almost identical completion times, while yours did not. As penance, I found an 8 min 1FS track, and ran it to DSD1024, 9th order on my system. Here is some comparative data. Note: this is on the faster v6.1.42. 2FS (24/96) Track Duration: 8m, 17secs Completion time: 1 hrs 15 mins 34.0248 secs Ave CPU util: 52% Ave Disk util: 33% on each of 3 paging disks 1FS (16/44.1) Track Duration: 8m, 24 sec Completion time: 2 hrs 36 mins 49.6789 secs Ave CPU util: 52% Ave Disk util: 33% on each of 3 paging disks This is exactly the result you would expect, knowing that 1FS has to process 1024 blocks vs. 512 blocks on 2FS. Double the blocks (work), double the time. This is linear scaling, as there is no bottleneck. The reason you're seeing 3x or greater is because you only have a single NVMe disk for paging. If you do a simple extrapolation from my data, I have 3 disks, each 33% busy. It's easy to see a single disk would be 99% busy. This would create a bottleneck, and cause completion time to grow nonlinearly. So I hope this provides a rationale for why a 2nd NVMe drive would help your machine. Heck, since you only need these for paging, I might advocate for filling all the NVMe slots on your motherboard with 1TB or even 500GB drives. My Asus TUF Gaming Z790 mobo has 4 M.2 slots, and I have 3 of them filled. I might fill the 4th one too!
-
I have a set of 6 tracks that I run on a build any time I want to look at performance. The data I'm looking at is the "Total time to process file" that is reported in the album log file in the output folder of each album. Finally, the ratio metric I'm reporting is the Total time to process file of the old build / Total time to process file of the new build, for the exact same track. The speedup with v6.1.42 is nothing short of astounding. for shorter tracks that fit within RAM, and that run with very high CPU utilization (over 80% across the run), I'm seeing ratios of 3-3.2x for longer tracks, I'm seeing speedups of 2-2.3x What is short/long depends on how much RAM your system has. In my system with 192GB RAM, short was around ~8-9 mins or less. I would urge anyone who previously tried PGGB DSD and found it "too slow" to give it another try. This is now a whole different ball game.
-

T+A SDV 3100 HV & PSD 3100 HV
austinpop replied to jrdiandrea's topic in DAC - Digital to Analog Conversion
The SD 3100 HV is an outstanding DAC, especially if you upsample content upstream to DSD256/DSD512/DSD2024 before sending to the DAC. This is the thread for the SDV 3100 HV and similar pieces: -
I use the time to process the same source track as a metric. You can find this in the log file.
-
@rayon As someone who has been in performance engineering for over 30 years, bottleneck analysis is something I have professional experience with, and that is what I've applied here. That said, feel free to consider or ignore my suggestions — it's totally up to you. 😀 On your specific points: I do not see significant processing time differences with input rate, because my system isn't bottlenecked. Here's an example of two almost identical duration tracks, one at 88.2k and one at 192k. [24-04-19 21:35:23] Track length: 6m:49.8s, input sample rate: 192khz, output sample rate: dsd512 [1] [24-04-19 22:10:05] Total time to process file: 11 mins 46.42 secs [24-04-19 22:10:08] Track length: 6m:58.0s, input sample rate: 88khz, output sample rate: dsd512 [1] [24-04-19 22:43:51] Total time to process file: 11 mins 23.0237 secs That said, once a system becomes bottlenecked, small perturbations can make a big difference, so in such a situation, input rate can make a difference, as can a number of other factors. You will find that if you relieve the bottleneck, the processing times for your 16/44.1 and 24/96 tracks of the same or similar duration will return to being very similar. By disabling hyperthreading, you effectively reduced the load on the system. How? Because unless you override it, PGGB will (Auto) set its workers (parallel threads) to equal the number of logical processors in the system. With HT on the 13900K, you have 32 LPs (8 hyper-threaded P-cores (=16 LPs), 16 E-cores (=16LPs)), without HT, you will have 24. If you care to confirm it, you could achieve the same effect by turning HT back on, and overriding the auto setting of workers in PGGB (click on picture of the gargle blaster for the hidden menu) to 24 workers. This is the thing about bottlenecks. You can alleviate them by either reducing the load, or adding more of the contended resource (relieving the bottleneck). The first can, in some cases, give a modest speedup because contention for a bottlenecked resource can actually be inefficient and so reducing contention improves efficiency. But you will not get the speedup you would if you resolved the bottleneck. In your case, adding one or more additional NVMe drives for paging, and adding more RAM will give you the most speedup if you want to process DSD1024x1.
-
Thanks for doing that. I thought it would be good to get the nitty gritty data analysis off on its own thread, so we could keep this thread devoted to PGGB function and sound quality. Geeks who want to dive into the nitty-gritty performance details are welcome to join the performance tuning thread.
-
@rayon I was curious, so I processed an 8m, 17s duration 24/96 track at DSD1024x1. I got a Completion time: 2 hrs 16 mins 29.4348 secs. My machine is not so different than yours, except I have: 192GB RAM 3 x Samsung 990 Pro NVMe Gen4 drives I use to distribute paging. During the run, here are some key metrics for each drive (they were all very similar): disk utilization: 13.4%, with peak of ~500% (this just means there was a pending queue depth of 5 I/O operations) read throughput: 54 MB/s ave, 1576 MB/s peak write throughput: 41 MB/s ave, 1503 MB/s peak You can imagine if all that paging I/O was concentrated on a single drive, its utilization would ~40%, and since you have only half the RAM I do, it would be even higher. So, my conclusion is that for true DSD024x1, you would be bottlenecked on paging disk and RAM. Since ZB has announced some significant performance improvements are impending, this will be great, but beware that reducing the CPU demand of the processing will only exacerbate the demand on the paging disk. Think of it this way: you'd need to the same amount of paging in a shorter amount of time. Hence, greater disk utilization. Your second NVMe should go a long way to relieving the bottleneck. For those who want to do an entire library at DSD1024x1, even 3 paging drives is not overkill, nor is 192 or 256GB of RAM.
-
@rayon A trio of suggestions. First, remove the 16GB paging file from your 660p drive. There is no requirement to have a vestigial paging file on the OS drive. Keep paging to your fastest NVMe. Or multiple NVMes when your 980 arrives. Second, I wouldn't get too hung up on the the disk read/write speed in real life vs. synthetic benchmarks. Remember, the latter are measuring sequential reads/writes of large files with large block sizes to the disk, where isn't necessarily how real apps, or indeed even the OS while paging, does it. Finally, if you really want to analyze the bottlenecks, you can actually set up a data collector in PerfMon, and record metrics for the entire processing of a file. You want to look at the big picture, and see when and for what durations, any one resource is becoming a bottleneck. This is how I've been doing it, and the data has helped ZB tune his algorithms. You've certainly chosen the heaviest workload by selecting DSD1024 output, so this does benefit the most from more RAM, and multiple paging drives.
-
BTW - regarding CPU utilization… a bit of a rabbit hole, so only read if you’re curious. In situations like this, we want to know the true utilization of the CPU, or really, what percentage of time all the cores in the package are not idle, as this tells us if there is an opportunity to get more work done, if possible. Sadly, what Task Manager displays is a metric called Core Utility. Even more egregious, while this metric can exceed a value of 100%, as you'll see from the definition below, Task Manager will cap it at 100%. All this gives the impression you are looking at Core Utilization, whereas you are looking at Core Utility. Here is one article explaining this in depth. https://aaron-margosis.medium.com/task-managers-cpu-numbers-are-all-but-meaningless-2d165b421e43 In essence, core utility = core utilization * current frequency / base frequency The metric is attempting to rationalize the fact that modern CPUs can boost above their base frequency up to the turbo max, and this should be captured in some way to represent the true capacity of the system. Well-meaning, but as a performance guy, I would rather look at the raw utilization and raw frequency data separately. I personally prefer to view Processor Utilization, as I want to know if I'm driving the system as optimally as I can. On PGGB, for example, you can control the load by the number of workers, although PGGB usually does a great job of picking the optimal number. Whether I am able to drive the cores to the highest possible frequency is a separate exercise, focusing on how well the coolers are managing thermals in the system, and then some judicious tweaking of parameters, either in the BIOS, or with utilities like Intel eXtreme Tuning Utility, to boost frequency without tipping over instability. This has traditionally been known as the art of overclocking, although with the 13th and 14th gen Intel, it's more the art of just getting the advertised turbo frequencies! So what tool(s) display core utilization correctly? Well, here's 3 tools that come with Windows, and you can see what they're showing: Here, PGGB is running, with a true "CPU" utilization (average of all cores' non-idle %) of about 90%. Performance Monitor (available in Administrator Tools) shows this correctly Resource Manager (can be invoked from the bottom of the Task Manager screen) is showing Core Utility of 137% Task Manager is showing 100%, which is Core Utility capped at 100%. I personally favor PerfMon, because I actually want to know the utilization, not the utility. There you go. More than you cared to know about Windows performance metrics. 😏
-
I personally just use a full disk partition, but cannot claim to have tested it both ways. But just logically, I don't think it should make a difference. The usage of the cache is dynamic, and based on disk accesses in real time. I'm not aware of any reaon, nor would it make sense, for disk partitioning to have any bearing on this. Ultimately, as long as disk utilization stays well below 100%, you've achieved your objective.
-
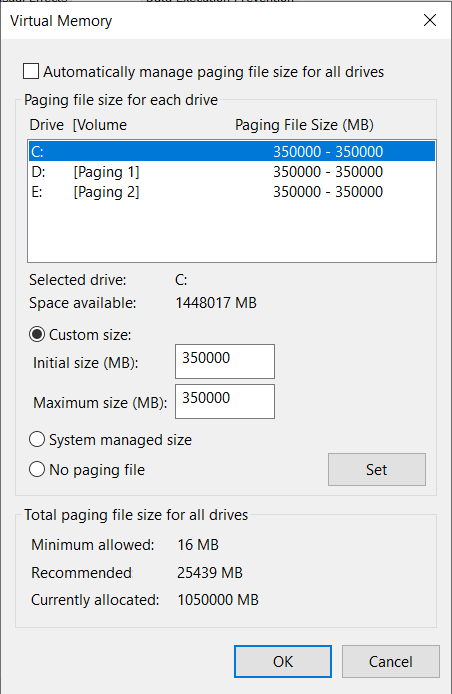
@rayon With regards to paging, I'm finding it even more beneficial to split the paging space over multiple drives. This prevents the paging I/O to saturate any single drive, thus becoming a bottleneck, and enables CPU to run at high utilization. In fact, on my new machine (14900K/192GB), I provisioned 3 Samsung 990 Pro NVMe drives, and I set up paging as shown: In hindsight, this was probably overkill, but I do strongly recommend 2 drives, it really helps with speed on systems where thermals are otherwise under control, as yours is.