

In this article, I walk through the process of using Focus Fidelity’s Digital Room Correction (DRC) Filter Designer software to calibrate my desktop speakers for accurate sound. Focus Fidelity’s Digital Signal Processing (DSP) software product costs US $250. In my opinion, using DSP to correct for any loudspeaker in any room is one of the best audiophile upgrades one can make to their playback system. As we will see, using Focus Fidelity’s Filter Designer makes significant improvements in both the frequency and time domains that are both audible and measurable.
Introduction
 As readers may know, I am a huge proponent of using DSP/DRC to restore the ideal frequency and timing response arriving at one’s ears, regardless of speaker or room. I have written several articles on the subject here at Audiophile Style and a book on Accurate Sound Reproduction using DSP. So when David from Focus Fidelity approached me about trying out his Focus Filter Designer software, I had a specific use case in mind that is highly demanding – desktop speakers.
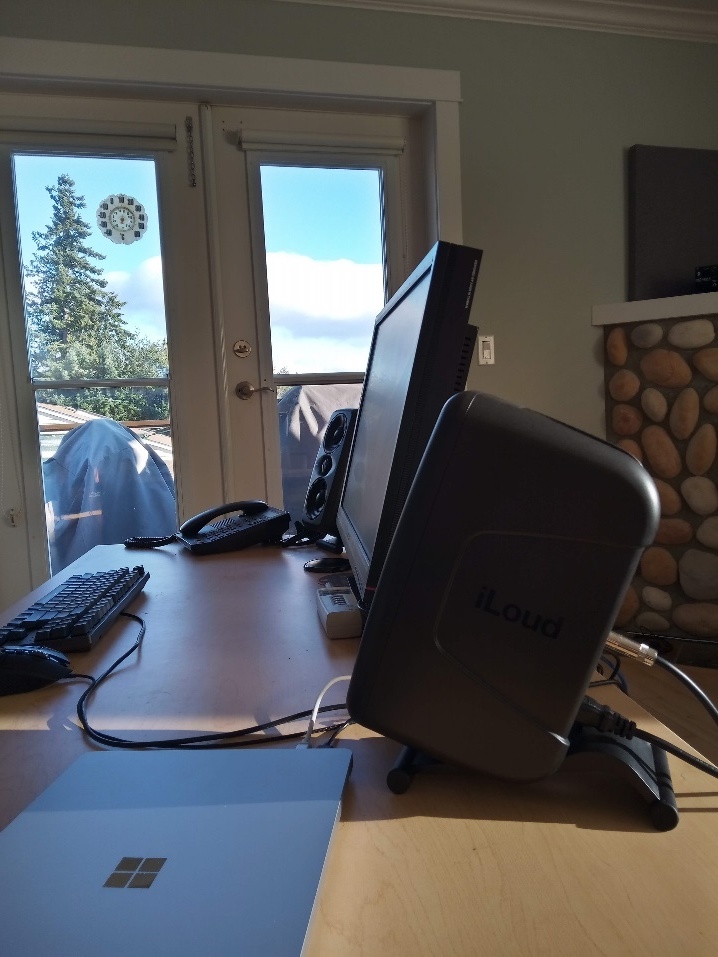
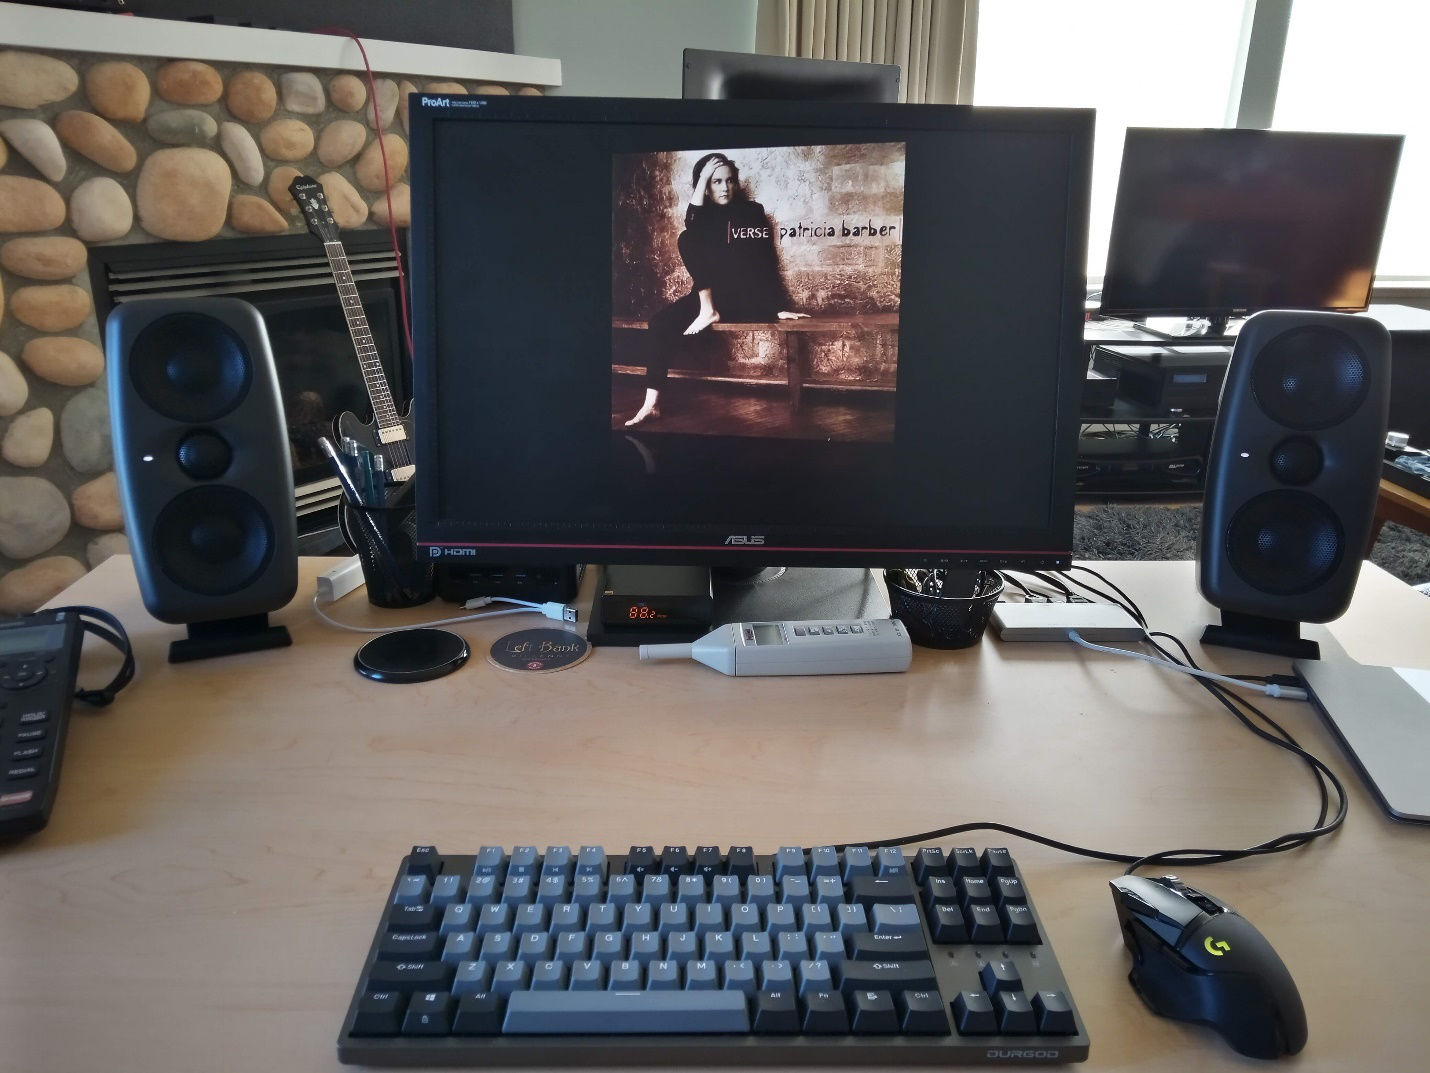
When I say desktop speakers, I mean speakers that actually sit on one’s desk:
Typically means an equilateral triangle of 4ft or less. In my case, my equilateral triangle is 38 inches. Desktop speakers are notorious for a) having little to no bass below 80 Hz and b) desktops are hostile environments as there are many obstacles to negotiate, mainly the reflections off the desktop itself which (significantly) colors the bass response of the speaker.
Folks that have tried this know what I mean. Dropping a pair of speakers on the desktop tends to make them sound “one note bass” and/or “boxy” sounding. To the point of being almost unlistenable. This article will show you how to design a custom digital filter using Focus Fidelity Filter Designer to correct these issues.
Desktop Loudspeakers
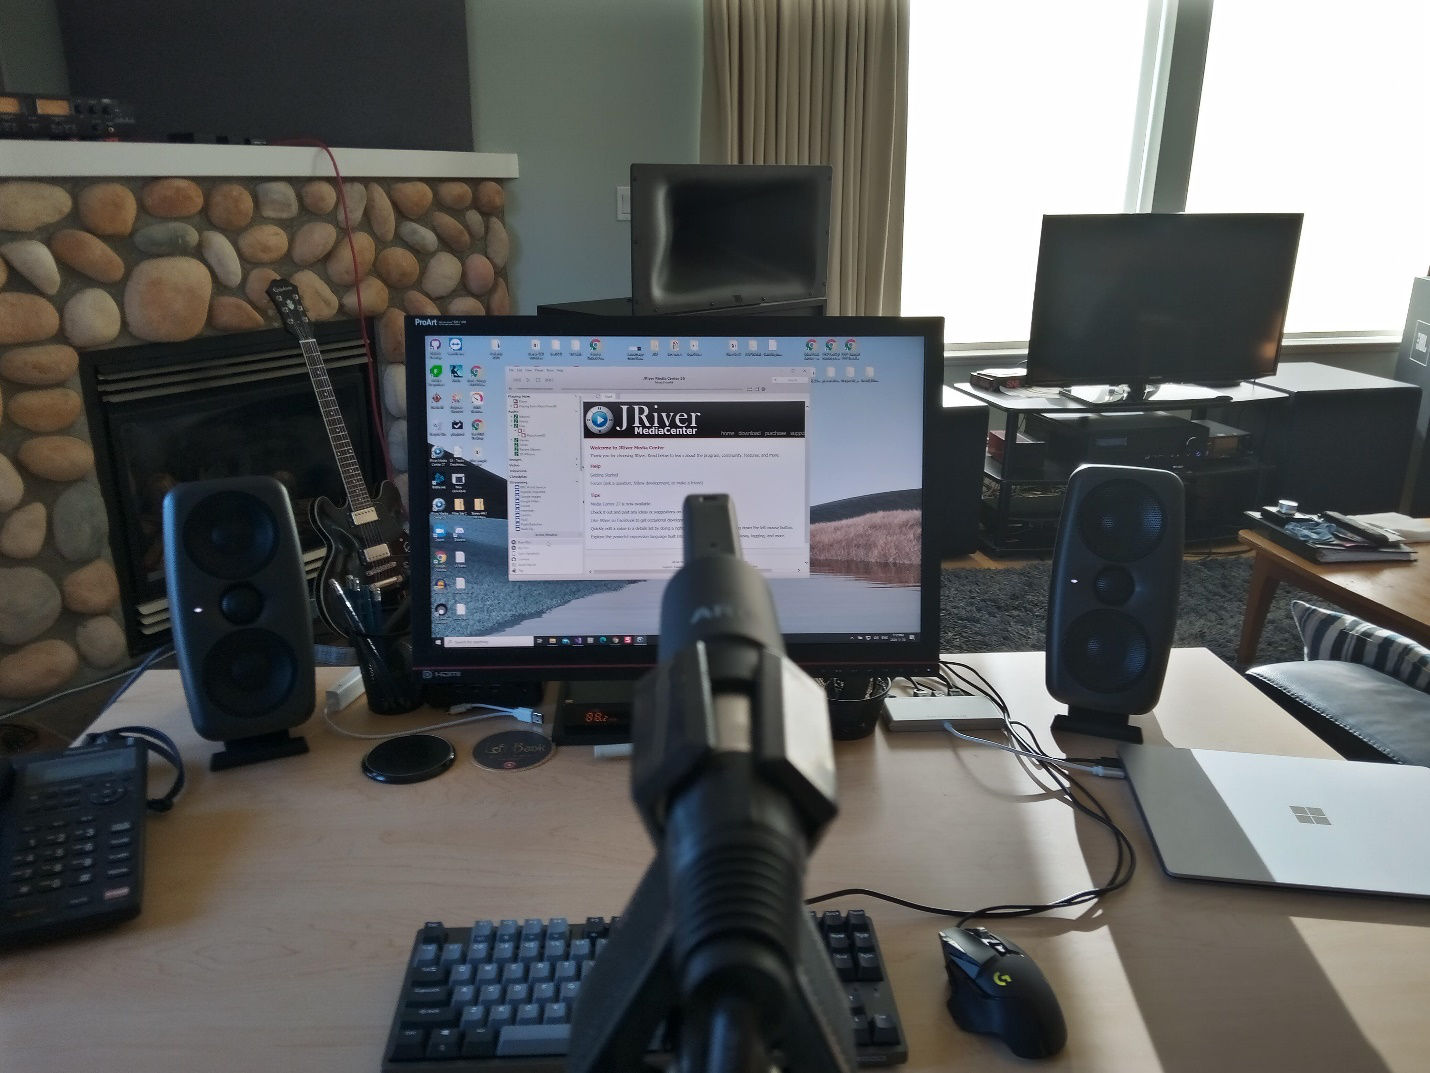
 I chose iLoud’s MTM speakers for my desktop for a variety of reasons. One of the main reasons was for extended bass response in such a small package. These little guys legitimately play down to 40 Hz. Most people that hear them are shocked at how low they can go. For sure, they can only play so loud before distortion becomes audible, but they can play at critical listening reference level (between 77 to 83 dB SPL C weighted) nice and cleanly. If you want louder, one can engage a 50 Hz or 60 Hz HPF on the speaker to reduce the bass distortion. For a desktop speaker, very impressive. Most speakers that go this low are not suited for the desktop (i.e., they are way too big).
While this speaker is marketed as a “high resolution compact studio monitor,” there is no reason that it can’t be used for music playback, critical listening or otherwise. The speakers come with a DSP/DRC product built into the speaker along with a measurement microphone. Just plug the mic in, hit cal and one minute later you have a calibrated speaker matched to whatever listening environment you are in. The DSP/DRC software is a minimal version of the same companies ARC System 3 as it has one “house curve” built into the MTM’s that is nonadjustable.
As we will see, the ARC System 3 does a pretty good job of eq’ing the MTM’s. But, Focus Fidelity Filter Designer is state of the art producing “textbook” frequency and time domain correction filters that fully optimizes these impressively designed full range speakers in such a small package.
Before we get started taking measurements, let’s talk about Focus Fidelity’s Filter Designer technology and overview of the process.
Thanks to Roger Salvesen at Tom Lee Music in Vancouver for getting me a great deal on the MTMs.
Focus Fidelity Filter Designer Technology Discussion
From the downloadable help file: “Focus Filter Designer analyses impulse response measurements taken at multiple positions in the listening area to build a time domain accurate mathematical model of the loudspeaker-input-to-listening-area "response" or transfer function. The model enables identification of resonant modes, phase distortions and reverberant field tonal balance as well as factors that should not be corrected for. The analysis of the model combined with the user specified target magnitude frequency response are inputs to the filter design process.
Audio playback through the filter combines with the loudspeaker and room characteristics to produce a total result that is substantially closer to the frequency and time domain targets set by the user compared to the loudspeakers and room alone. The process is particularly effective at reducing effects of resonances caused by standing waves, reversing loudspeaker phase distortions and at correcting tonal balance. The software does not attempt aggressive correction that would,
- be highly position dependent
- produce filters with significant "ringing" especially pre-ringing.
- drive existing minimum phase behavior towards linear/zero phase, the target phase behavior is minimum phase therefore inversion (correction) of some existing maximum (excess) phase behavior will be included.
The design process follows a "wizard" style left to right type workflow beginning with importing measurements and ending with viewing predicted results at each measurement position and exporting the filters.”
The clue here that this is serious DSP software is given by the use of the engineering term transfer function. Other forms of eq such as parametric eq’s and IIR filters miss ½ of the transfer function in the time domain when it comes to loudspeakers in rooms. While there is some debate about our ability to hear time domain differences, I believe this is an area that deserves more research. These ears definitely hear the benefits using sophisticated DSP software to correct both the frequency and time domain of loudspeakers in rooms.
Specifically, my experience with time domain correction has been that the bass response in the room is much clearer. It is one thing to have even bass, but quite another to improve its clarity in the mix. The other aspect that I notice is an increased depth of field of the sound image that has the same size and scale as the height and width of the stereo image. I liken it to moving from a flat 2D sound presentation to 3D sound. Once you tune into it, one can tell pretty quickly if a sound system has been time domain corrected or not.
I asked David Broadhurst, the creator of Focus Fidelity Filter Designer more about his unique approach to time domain correction:
“Focus Fidelity Designer takes unique advantage of measurements at multiple positions. The software analyzes the measurements in both the time and frequency domains to determine what aspects of the measurement data should and just as importantly, should not be included in the filter generation. The resulting mixed-phase filters apply a stronger correction to factors common to all measurement positions resulting in an improved impulse response across the listening area”
Several of my past articles on Audiophile Style have references to room acoustics that I am not going to repeat here. However, one takeaway to always remember is that below a room’s transition or Schroeder frequency, the room is in control of the bass response and not the loudspeaker:
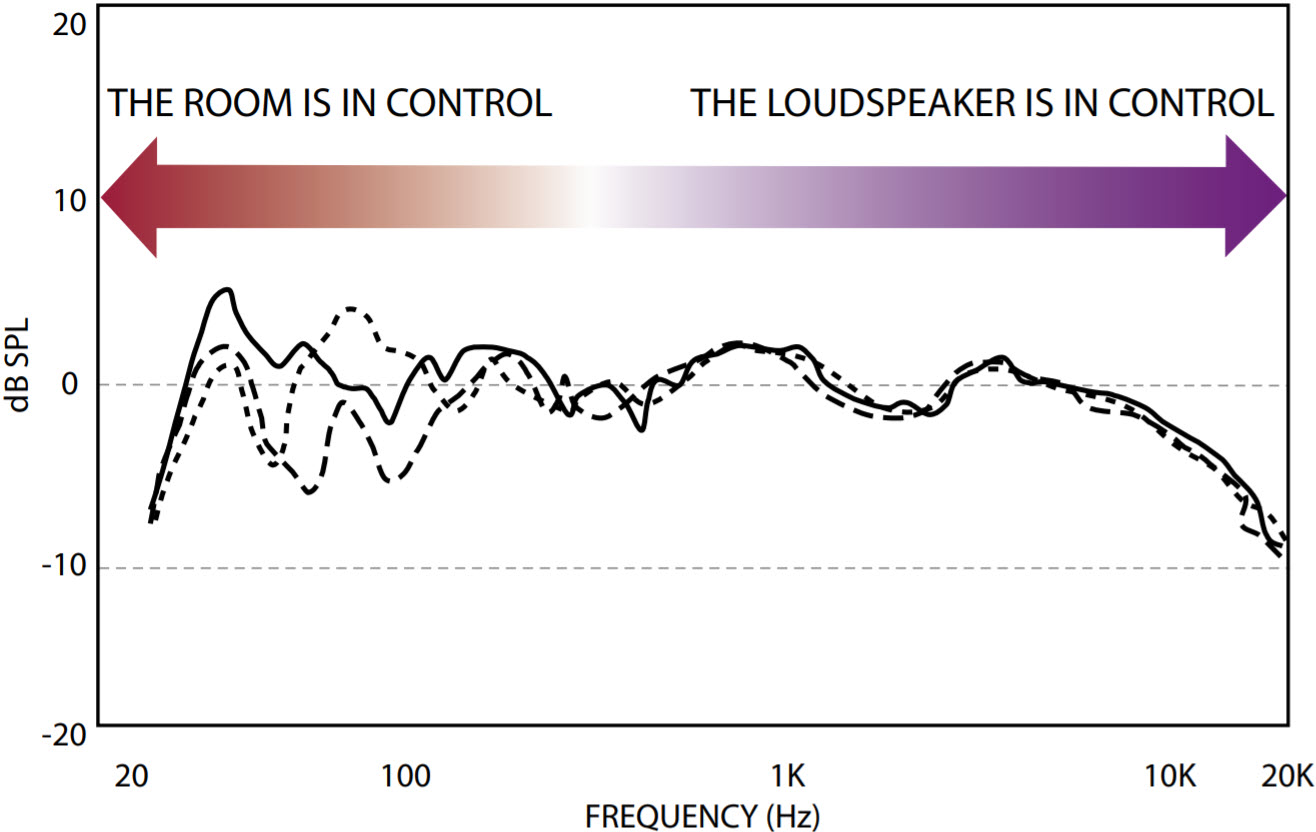
The chart above is from Floyd Toole’s excellent article on Audio- the science in service of the Art. As Floyd says, “In the investigation of many rooms over the years, I would estimate that something like 80% have serious bass coloration.” Further, Floyd’s research shows that bass subjectively accounts for 30% of how we judge speakers sound quality. And “ANY loudspeaker can sound better after room EQ, so long as it competently addresses the bass frequencies - this is not a guarantee, but really is not difficult for at least the prime listener.” I am in total agreement.
As we will see, my desktop speaker measurements are afflicted much in the same way. Let’s get started.
Taking acoustic measurements
One can use a variety of acoustic measurement software to take the measurements. I use REW as it is a tool I have been using daily for over a decade and very familiar with it. The idea is to take measurements in and around the sweet spot of where you listen. First, I started out with left and right at the center listening position. Note this is with no ARC3 filtering, the MTM’s were set for flat response, and 40 Hz extension:

This is what I am talking about. Regardless of speakers or room, I have consistently found +20 dB SPL peak to peak variability in the low frequency response due to room modes and reflections. In my case, as perceived by our ears, bass notes at the peak (~135 Hz) will sound 4 times as loud as compared to bass notes in the dip (~ 80 Hz). This is what gives the “one note” bass sound. Think of it like a resonance, of the same type as blowing air across an empty Coke bottle, except tuned at 135 Hz.
It gets worse for desktops as it can cause more hassle over a wider range of frequencies. Here I have a peaky response all the way to 700 Hz, which in addition to the “one note” sounding bass, I also notice a distinct “boxiness” to the sound. Like I said in the intro, almost unlistenable. Pro tip: it isn’t the speakers fault.
Let’s take a look at the step (timing) response:
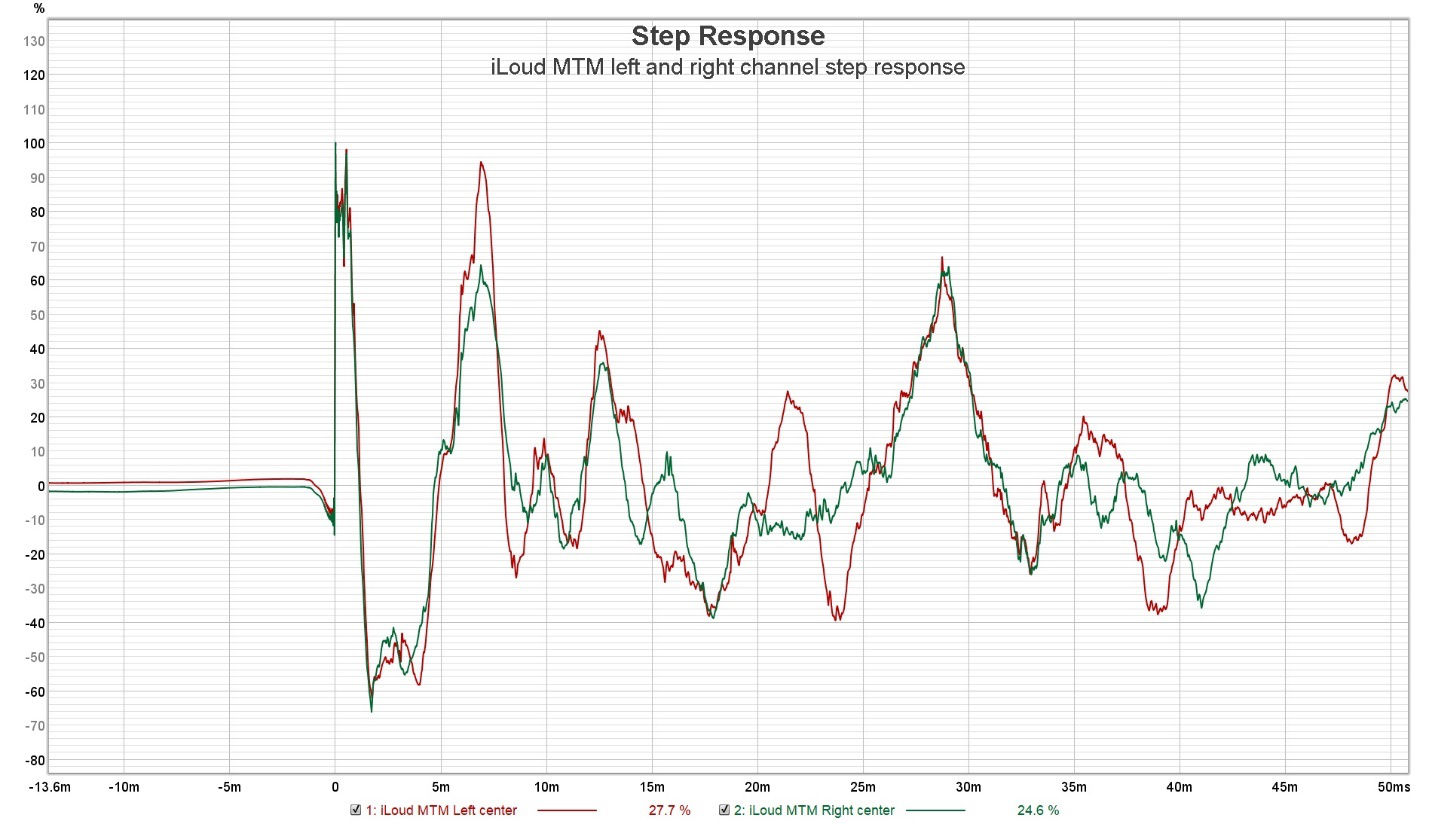
It is not bad. The speakers are pretty much time aligned, but we can see a large positive amplitude peak at about 7 milliseconds that is virtually the same level as the direct sound at 0ms. Folks, this is what causes the bass to not sound clear. We have two sound cues at almost the same amplitude, separated by 7ms. To put it into an audible perspective, here is a demonstration over headphones to hear what this amount of delay sounds like on an audio signal: https://www.youtube.com/watch?v=UQOkSF8auFc&t=245s With this comparison, it is now easier to understand why the bass may sound blurry or disjointed or not clear.
One can see another buildup of sound near 27 ms., not what we want.
Focus Fidelity recommends taking 6 to 10 measurements around the listening area. I took 8 measurements around the listening area per channel for a total of 16 measurements:

I moved the mic around roughly a two-foot radius in the listening area and a bit wider in the horizontal plane. As we can see not a lot of change from position to position, but we sure can see the room’s response impacting (or imprinting itself at) all positions. This is what we want to correct for.
To use Focus Fidelity Filter Designer, we need to export the measurements out of REW as wav files and import them as impulse responses into the Designer. Select Export from the REW file menu and select “Export all impulse responses as WAV”:

Then select a folder you want to save the wavs to:

Now we are ready to import the REW exported impulse responses into Focus Fidelity Filter Designer.
Importing Measurements into Focus Fidelity Filter Designer
Here I launched the Filter Designer and under the File menu, created a new project:
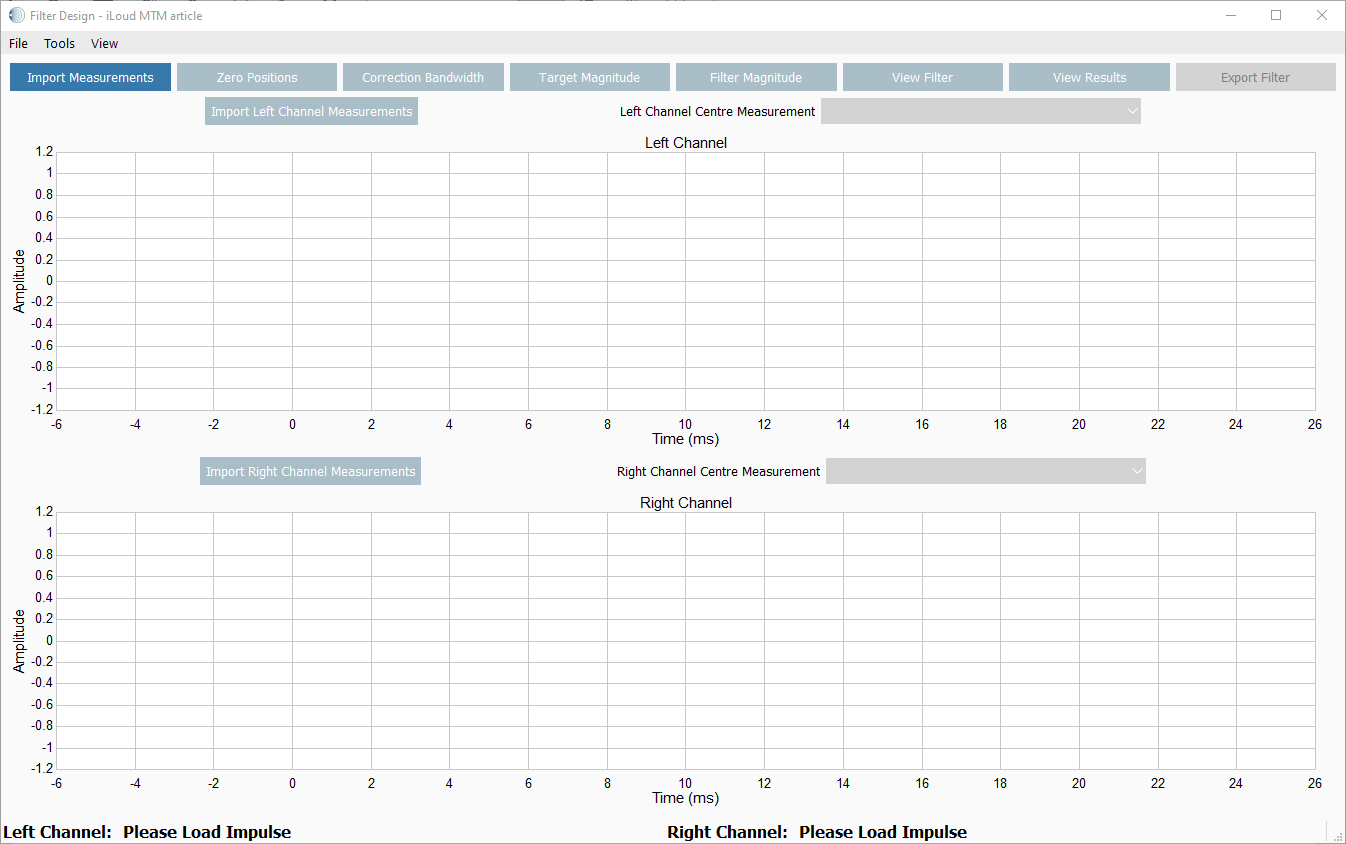
Import Measurements
Following the Wizard like workflow, the next step is to load the impulse responses. Click on Import Left Channel Measurements. When done, import the right channel measurements:

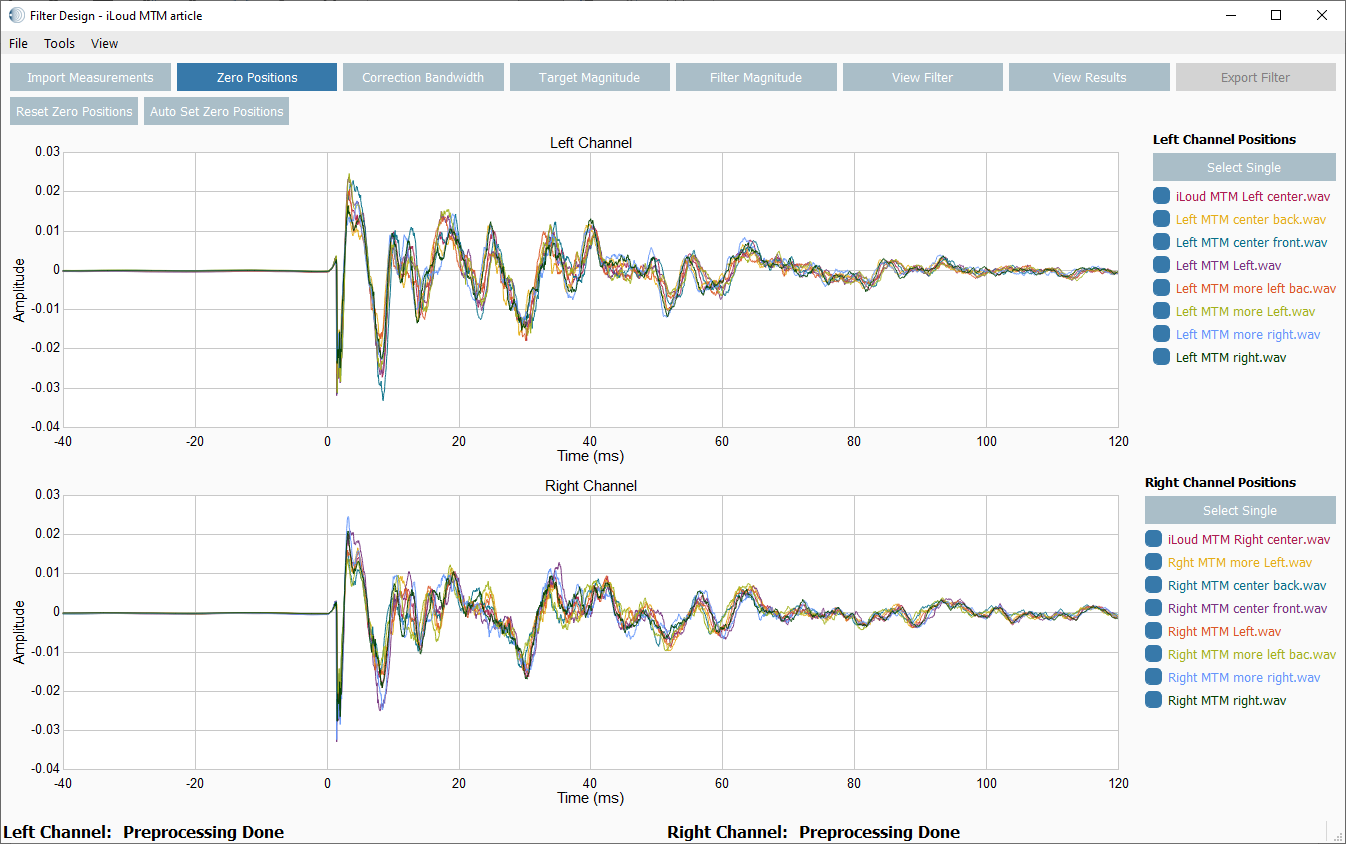
Here we see the impulse (step) responses for each channel. Note highlighted in the green square is a drop-down list of the imported measurements. Be sure that the proper center channel is set for both left and right channels. Side note: in the case of REW exports all of the impulses start at the same time, but have not been zeroed positioned yet.
As we can see, the step response is polarity inverted. In my previous REW measurement, I inverted the polarity so it is easier to look at. The MTM’s are negative polarity, not that I can hear the difference flipping the polarity. Focus Filter Designer inverts the polarity automatically as part of its workflow.
Even though I moved the mic around a 2-foot radius, including front and back, and even wider from side to side, we see that the pattern is similar to all measurements. The room and reflections are having their way with the response, no matter how the speakers are positioned. I went through that exercise prior to starting this article trying to get as smooth as a response by moving the speakers (and desk) around. But this is pretty much what it is no matter what I do. Thank goodness for DSP as I would not be able to listen to them otherwise.
Now is a good time to import the calibration file for the microphone.
Import Mic Cal File
Click on Tools and select Microphone Calibration. Then click Import File. Navigate to your mic calibration file and click OK:

The Filter Designer requires the microphone response be extended to 0 Hz and up to half the sampling rate (the sampling rate being set by the previously imported measurements). The response below 10 Hz is set as a flat line with constant gain over frequency rather than as a high-pass slope. This is to prevent the compensation for the microphone response from producing excessive gain at very low frequencies.
Set Zero Positions
Click the Zero Positions button to move to the next stage. Each impulse response has a time delay before any sound arrives at the measurement microphone. This is due to the distance between loudspeaker and measurement microphone. The imported measurements will show different delays for each position due to differing distances (note as mentioned, not REW impulse exports). The purpose of this stage is to align the measurements close to a time of zero effectively removing most of the delay. This aligns the impulses with the software’s internal processing and “windowing.” Note that the alignment done here does not determine final accuracy of this processing.
Click the Auto Set Zero Positions button. This will automatically align the measurements with the time delay reduced to a target of 1 millisecond:

Now we zoom in on the response by right clicking the mouse button and drag from top left to bottom right over the area you want to zoom in on. Right double click will zoom back out.
Next click on Correction Bandwidth.
Correction Bandwidth
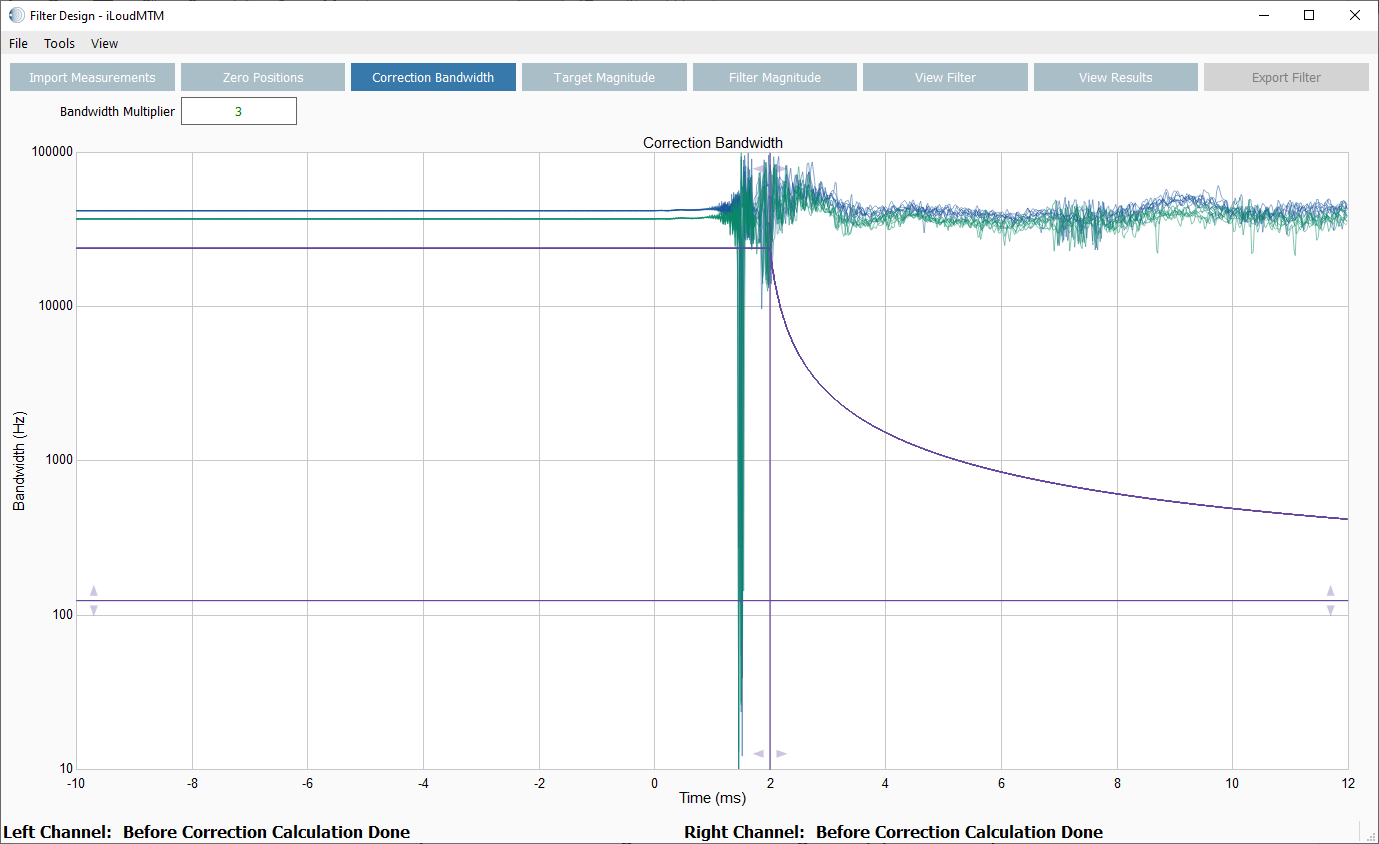
The high frequency content of the impulse response, which parts of the filter generation algorithm include, decreases with time. This prevents the resulting filters from being overly position dependent as would otherwise be the case due to the short wavelengths at high frequencies and variability of reflection timing relative to the direct sound. The correction bandwidth is set in this stage of the design process, the graph shows how correction bandwidth decreases with time. The measured impulses are shown on the graph so that the bandwidth can be viewed relative to the impulse response measurements.
The rate at which the bandwidth decreases is determined by the “Bandwidth Multiplier Direct Sound” setting at the top left.
The vertical marker line with left and right arrows determines the time at which the bandwidth begins decreasing. This should be set to after the direct sound. The horizontal market line with up and down arrows determines the bandwidth which the filter generation process always includes.
Hovering the mouse cursor over the marker line will highlight the line and show a legend box with the line’s current position. Pressing and holding the left mouse button with the line highlighted allows the line to be dragged, release the mouse button when the line is in the desired location.
It is recommended to initially leave these settings at the defaults shown. However, once you get the hang of it, I recommend coming back and adjusting some of the settings, generate filters and listen. It is a lot to wrap one’s head around to what is happening here and takes some time to associate what one is hearing based on what parameter has been adjusted.
Next click on Target Magnitude
Target Magnitude

The Filter Designer automatically provides the best fitted target through left and right channels. The best fitted target is intended to be an initial starting point which retains the current tonal balance of your system and room. The correct target curve is the one that sounds right to you and several iterations over a few listening sessions maybe required to arrive at your ideal target.
I pulled the last couple of sentences from the manual and agree with the approach/conclusion. Your ideal target is likely not too far away from the best fitted target for your speakers and room. I wrote a section on what to listen for while listening to accurate sound.
The target editor includes several features for editing the shape of the target magnitude. I am not going to walk through all of them, but suffice to say, I don’t think there are any limitations on what folks can adjust to achieve the best sound.
I tailored the target a bit by selecting a 48 dB per decade roll off in the low frequencies. 12 dB per decade on the very top end. One can play with the “slope” of the target. I suggested to David that perhaps dB per octave may be more familiar with folks, so he is thinking of making this change in the next software release.
Perhaps folks can see the issue as to why the un-equalized response would be tough to listen by looking at the target curve. The “area above the curve” has considerable excess energy from 100 Hz to 700 Hz. Our ears are more sensitive to peaks than dips as the research shows. This is why we are not too concerned about “filling in” narrow band dips. Next click on Filter Magnitude.
Filter Magnitude

The filter’s frequency range, maximum gain and maximum attenuation are adjustable in this stage.
The top horizontal marker line allows adjustment of maximum filter gain, the lower horizontal marker adjusts maximum attenuation.
The left vertical marker line sets the low frequency limit of the filter, this is the frequency at which the filter starts transitioning to 0 dB of gain, and similarly the right vertical marker line adjusts the filter’s high frequency limit.
The high frequency limit can typically be left at 20 kHz
One can see I have adjusted the left marker to 43 Hz as I don’t want any gain below the cut off frequency of the speaker. This prevents any excess low frequency distortion. This is a common mistake to try and boost frequencies below the intended design of the loudspeaker. However, the lower volume you listen to, the more you can get away with. In my case, I chose these desktop speakers because of their ability to make it to 40 Hz and play at reference level. In any case, set the low frequency limit to a frequency that corresponds to the capabilities of your loudspeakers.
View Filter
Click on view Filter Frequency Domain:
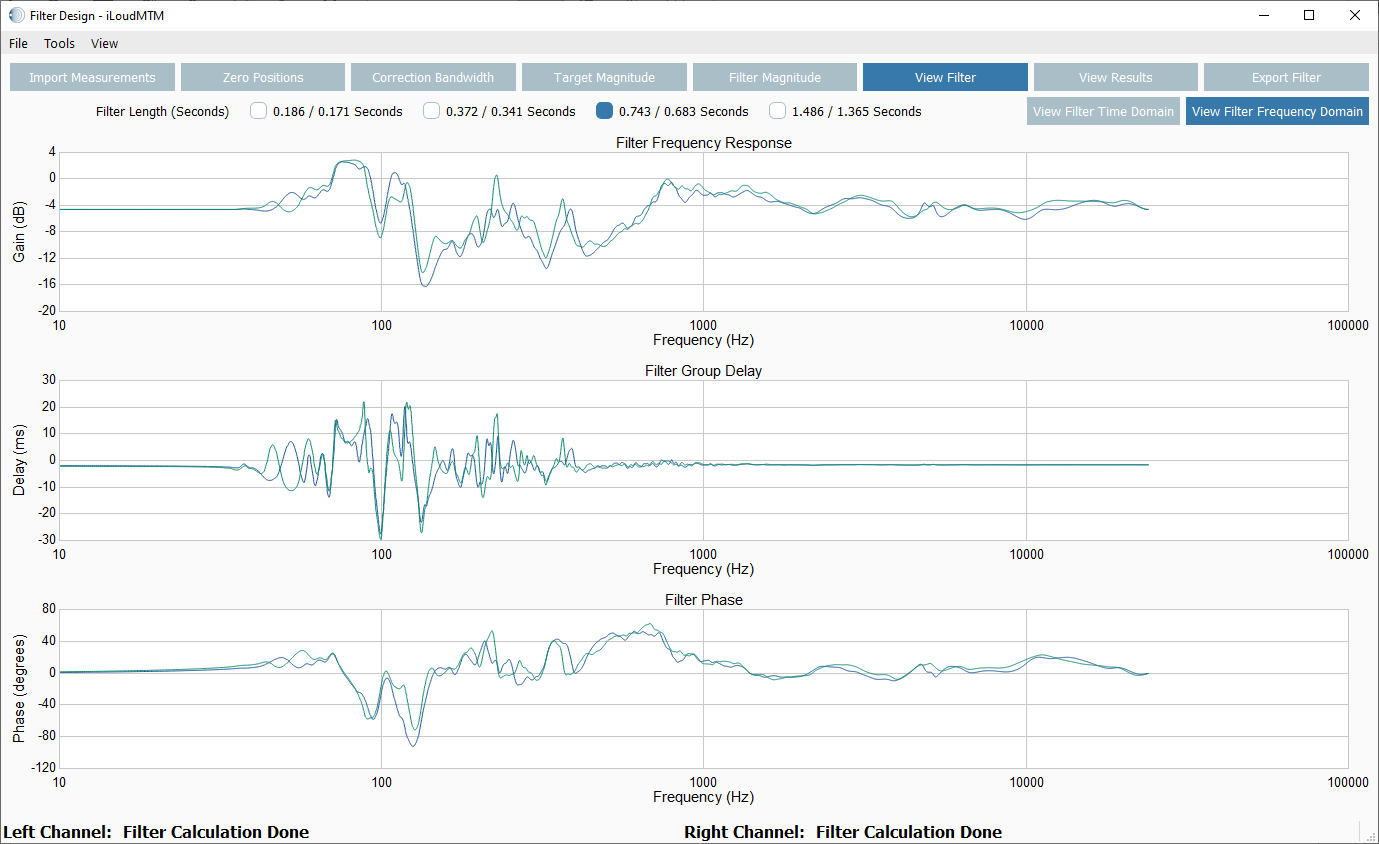
The length of the generated filter is selectable by selecting one of the 5 check boxes. Two times are shown for each check box, the first number (e.g. 0.743 seconds) is for filters with a sample rate that is a multiple of 44100 Hz and the second time for multiples of 48000 Hz.
Longer filters provide greater frequency resolution but require more processing to apply to the audio signal. Typically processing is not an issue on modern PCs. The default selection shown of 0.743 / 0.683 seconds should be suitable for most applications.
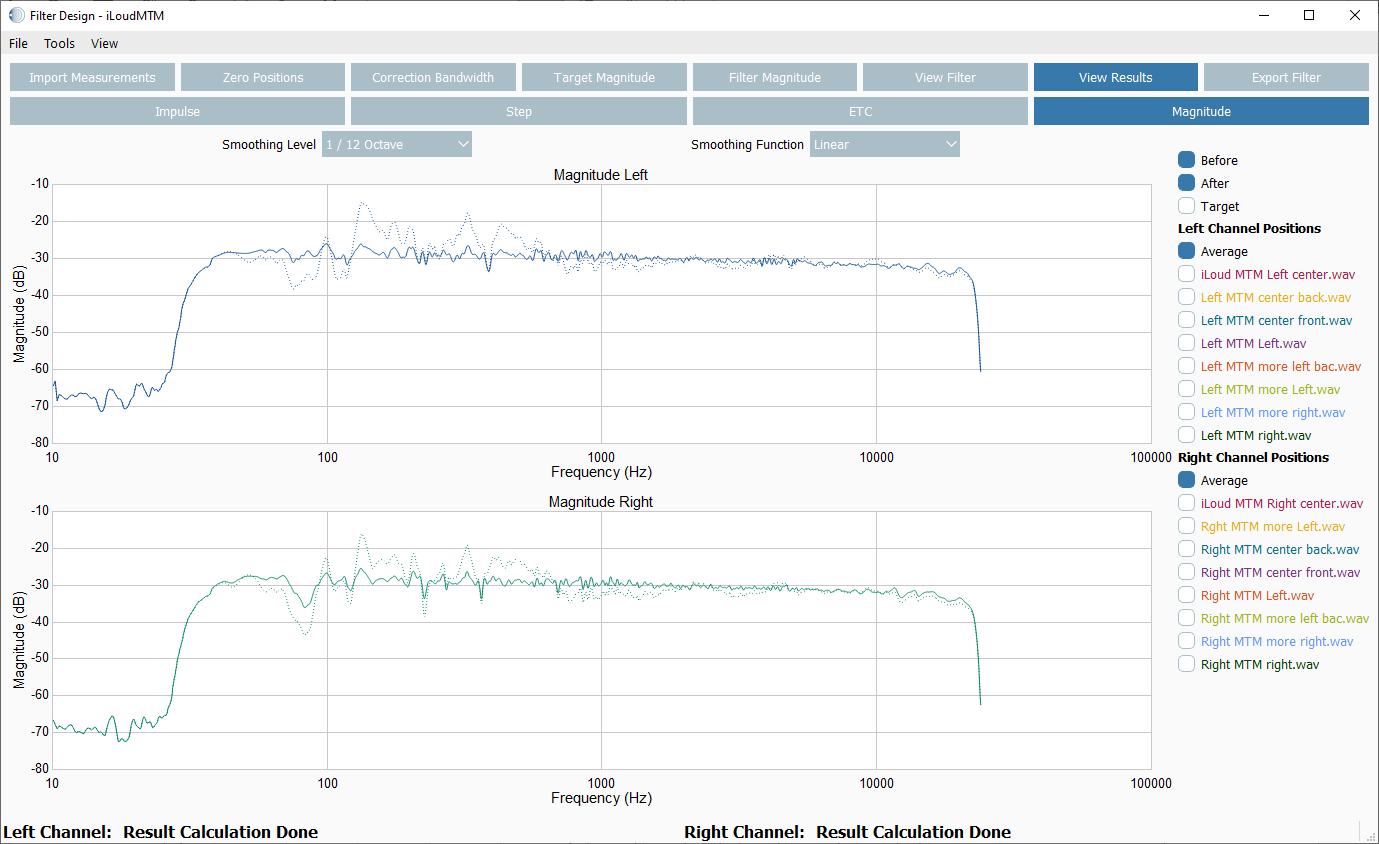
This is what we like to see. Here we can look at any of the individual responses, but I chose to look at the average and the “before and after.” Let me zoom in on one of the channels so you can see what we are talking about:
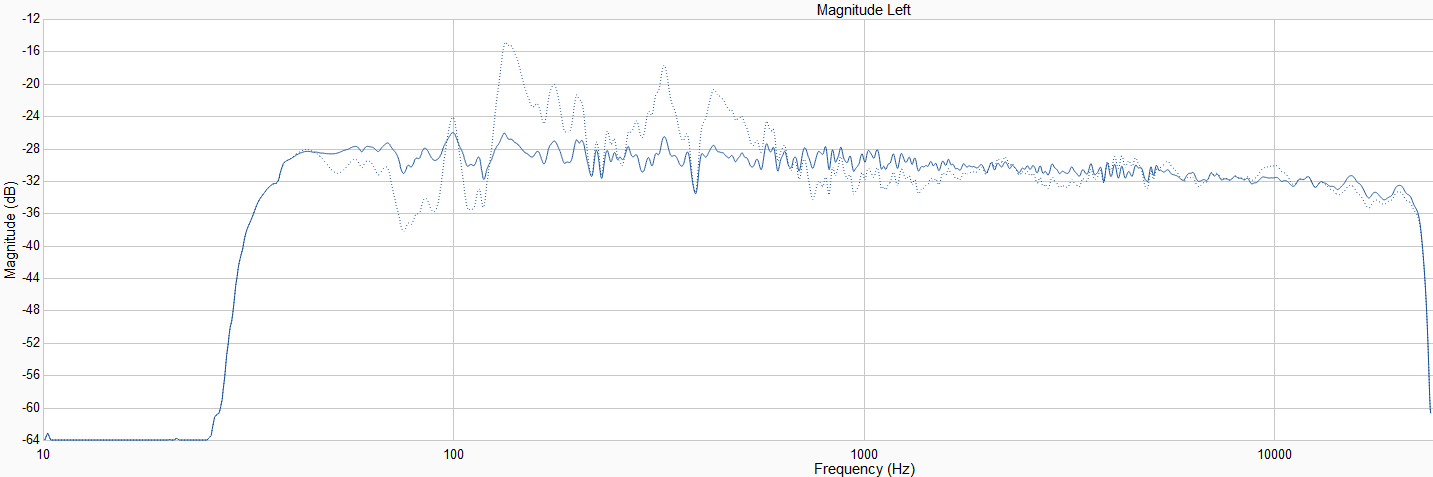
Here I am looking at the left channel magnitude and as we can see, and I hoped for, a nice smooth response overlaid on the original response that is lighter in color with the excess energy in the 125 Hz to 700 Hz range. As our verification measurements will show, right on the money!
Let’s look at the before and after step response of the left channel:
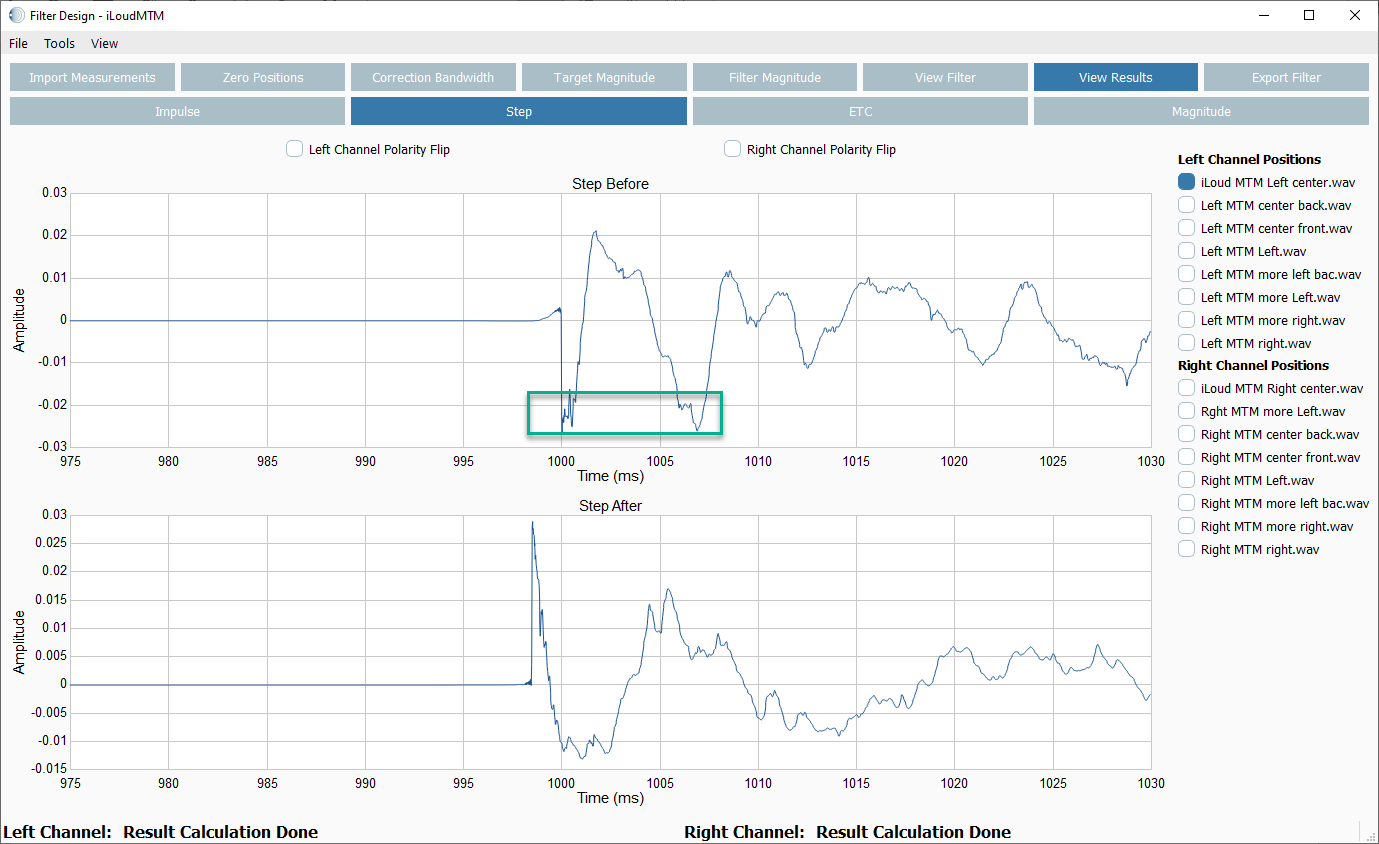
While the original signal is inverted, we can see the two peaks in the response, the latter 7ms later from the direct sound peak, highlighted by the green box. It literally is at the same level. Not good, as discussed why earlier. The corrected response looks virtually “textbook” with no preringing artefacts at the beginning of the step, with a sharp vertical “step” and then the ideal minimum phase low frequency roll-off that is well behaved over time. Can’t wait to hear it. Click on Filter Export.
Filter Export

Here I chose 32-bit float as the stereo .wav filter format. Virtually any music player’s or standalone convolver can host 32-bit float correction filters. Refer to the Filter Designer help file for filter installation instructions for JRiver and Roon or your specific music player/convolver configuration instructions.
Filter Verification Measurements
Before I get into the listening results, which I did days prior to measuring the filters, I wanted to show the frequency and timing response of the correction filters. I used a loopback method into a convolver hosting the correction filters to take these measurements. Let’s look at the frequency and timing response on their own first and then make a few comparisons.
Frequency response:
Nice smooth response. Solid bass response to 40 Hz and HF response past 20 kHz. No over correction on the narrow band dips.
Let’s look at comparing one of the measured channels before and after correction:
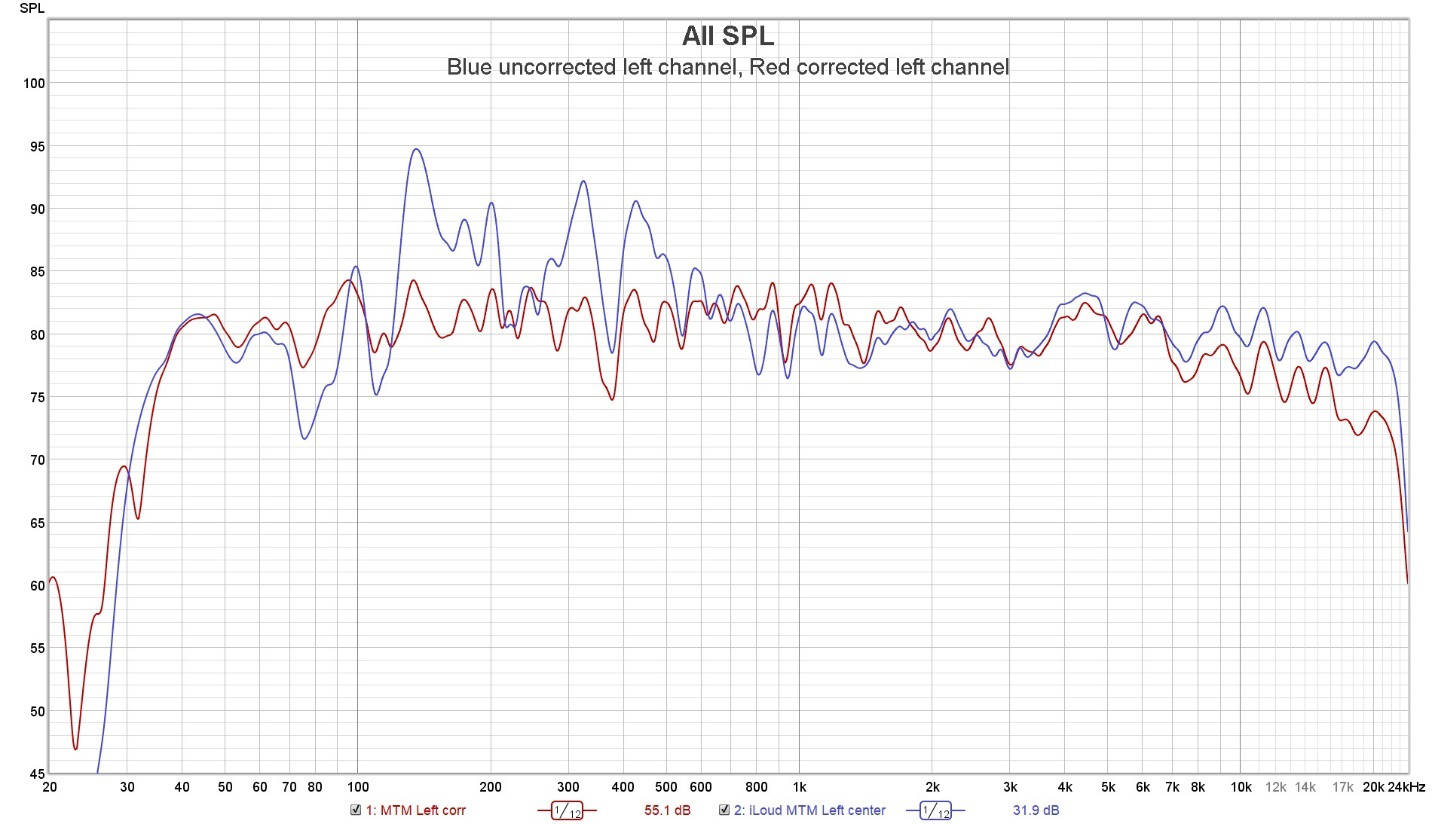
Looking at the left channel, the blue trace is uncorrected and the red trace is corrected. The wider dip between 70 and 90 Hz is filled in, the dreaded 125 Hz “one note bass” got KO’d and the “boxy” 300 to 500 Hz sound is significantly reduced. I “tilted” the response a bit from 6 kHz onwards as a tonal change from a bit overly “sibilant” to nice and smooth to these “hypersensitive to high frequencies” ears.
What about the timing or step response?

Virtually textbook perfect minimum phase response. For those looking to better understand how to read a step response chart, I go into detail in my accurate sound article.
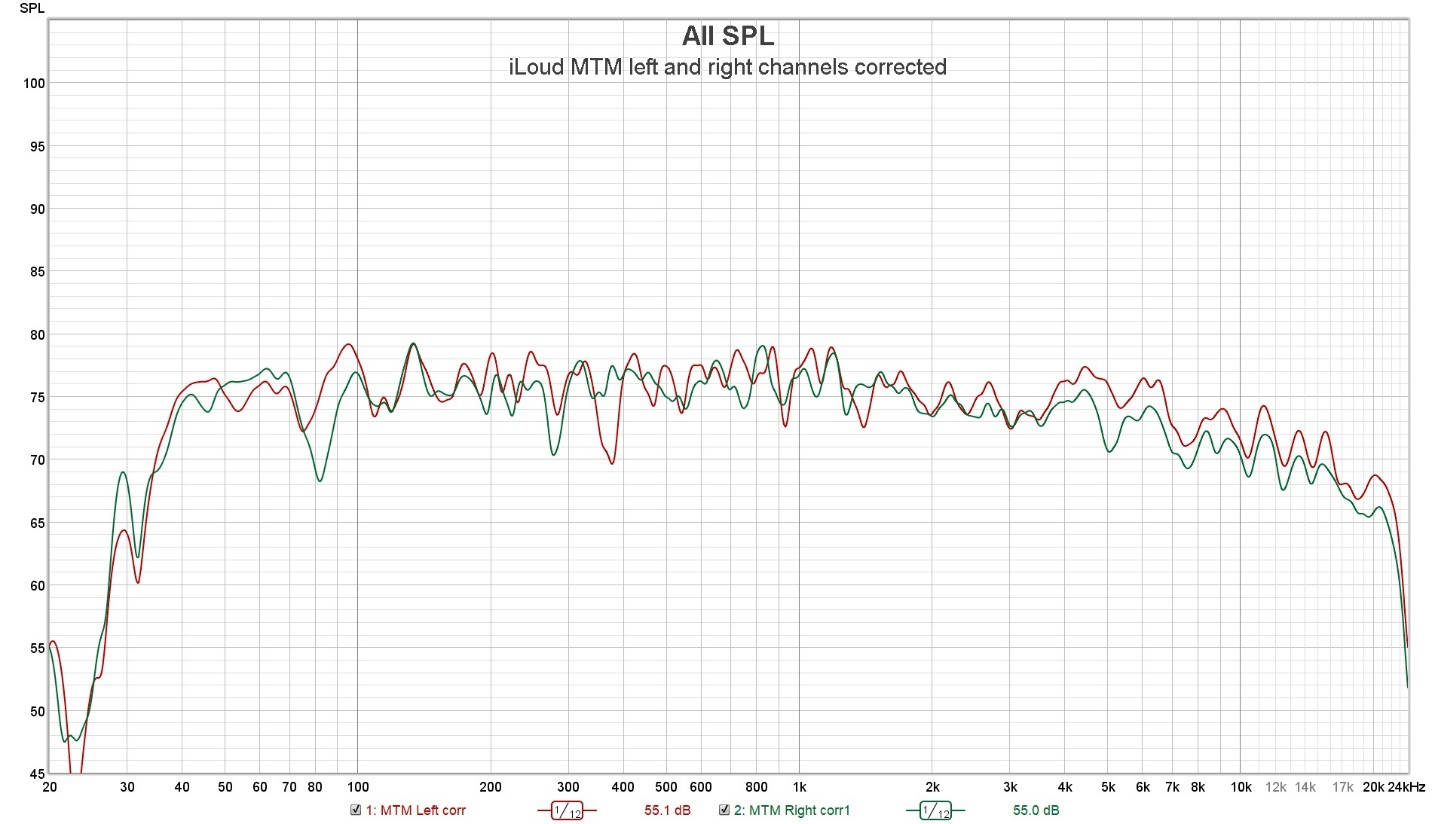
The point I want to make is not only is the left and right channel direct sound arriving at my ears at exactly the same time, and fully time aligned, both channels are perfectly balanced “over time.” These attributes are how we hear the depth of field into the recording as there are no channel imbalances not only in magnitude, but also over time.
Let’s look at the left channel corrected and uncorrected timing response:
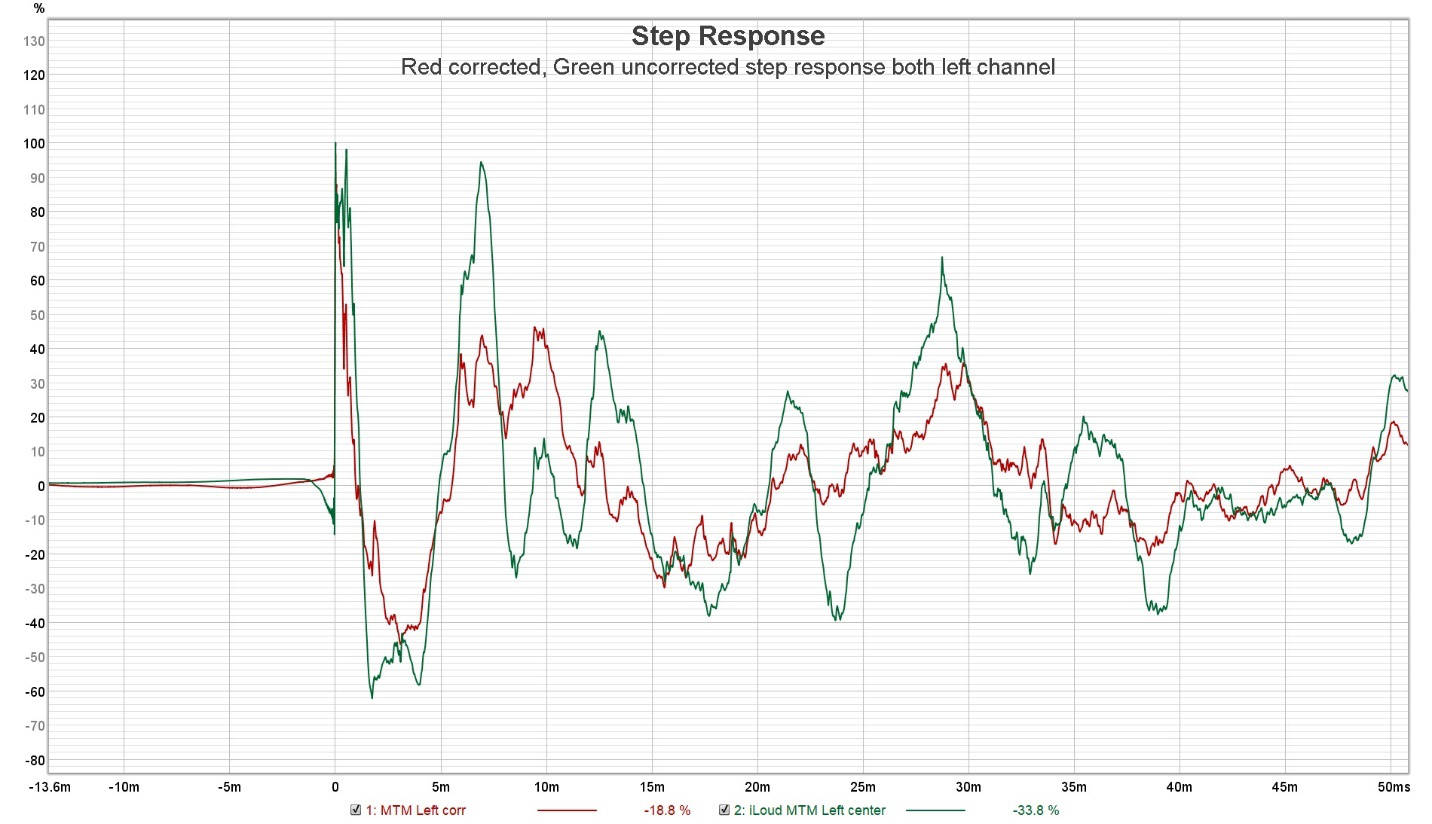
As we can see with the red corrected channel provides sharper time alignment and major reduction of the same level amplitude peak at 7ms. The bass sounds much cleaner as we don’t have a reflection at 7ms giving our ears the cue of blurred bass response.
Further, astute readers may see a pattern with the red trace as it moves up and down like a sine wave over time. This matches the ideal minimum phase response in the room, again clearer bass, but also the proper timing response so that we are not getting confused cues which destroys the depth of field imaging. Notice the “out of step” response of the green trace.
What about ARC System 3 room correction that comes built-in with the iLoud MTM’s?
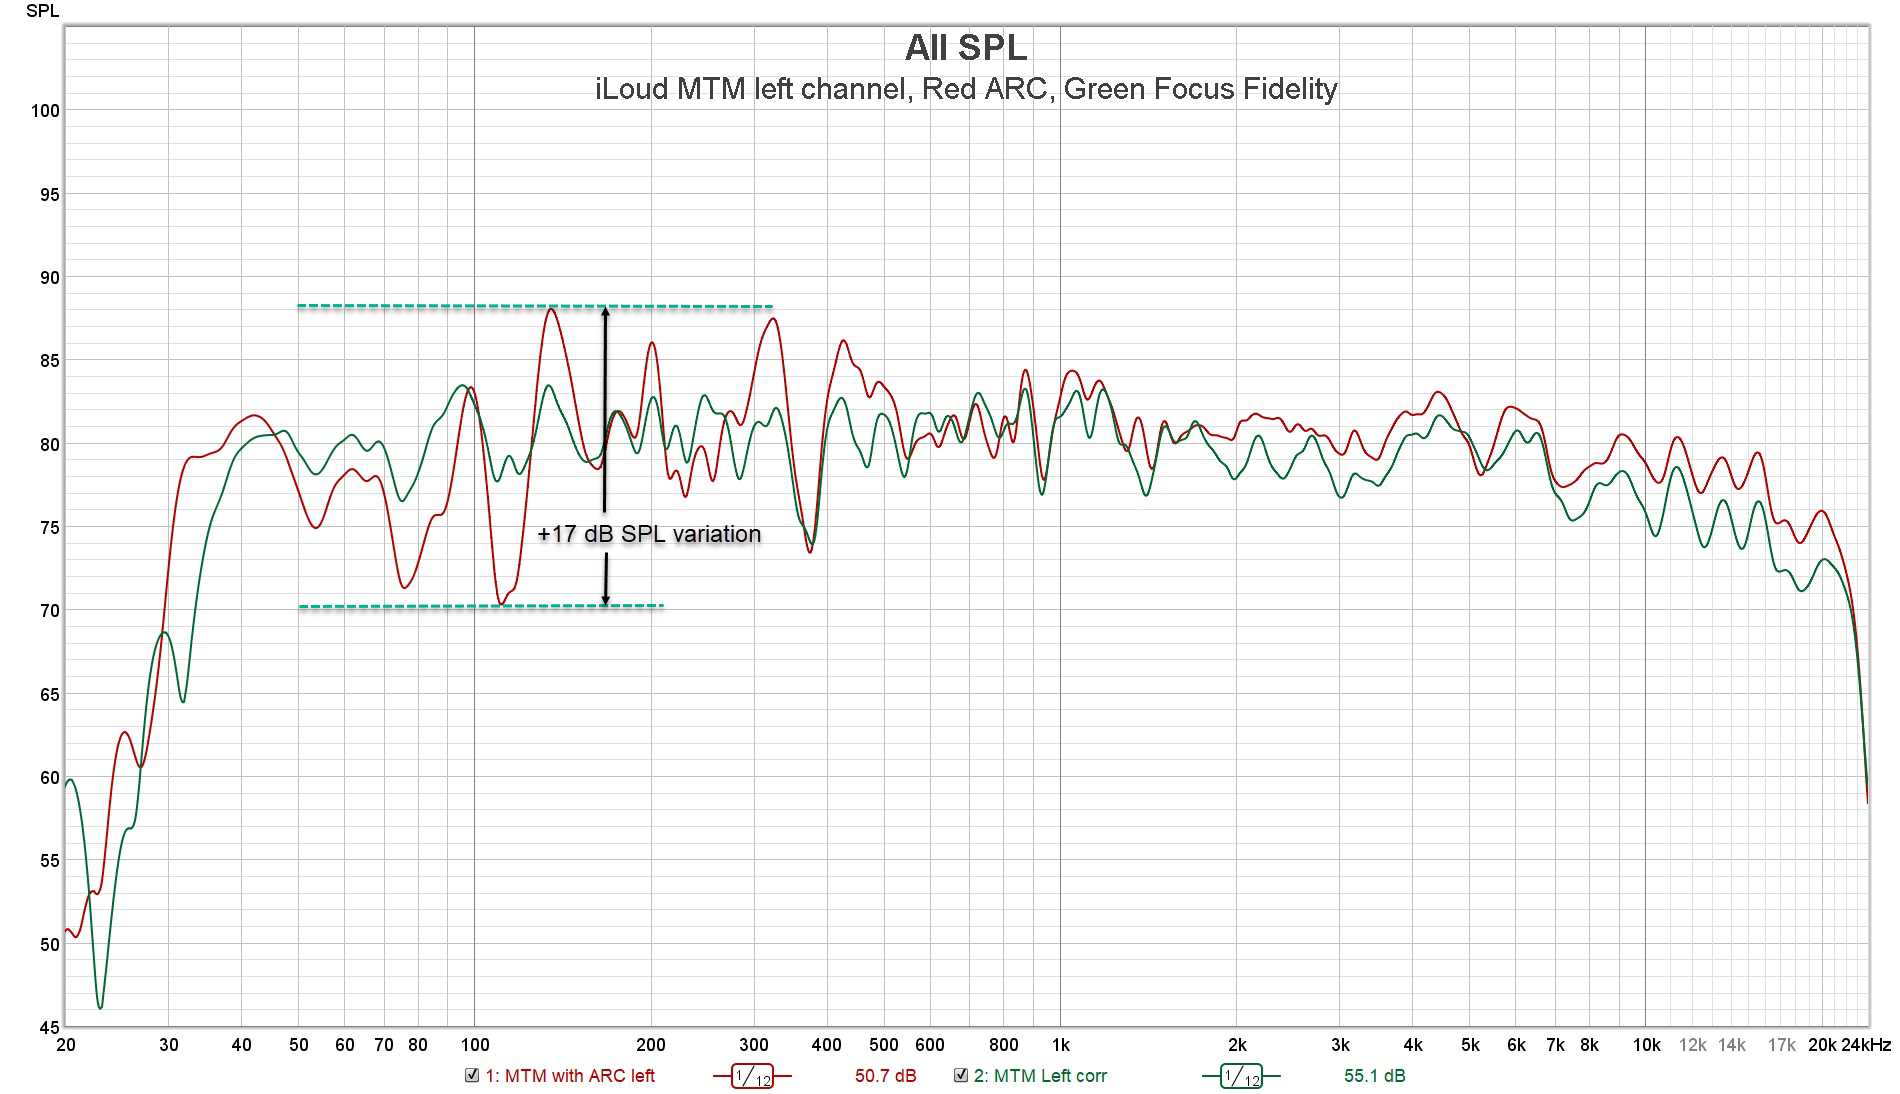
The red trace is the ARC 3 corrected response and the green trace is Focus Fidelity’s corrected response. ARC 3 does a good job of smoothing the response, but that “one note” bass peak at 135 Hz still has +17 dB of peak-to-peak SPL variation. Focus Fidelity’s correction filter is only 6 dB of p-to-p response variation or within a +-3 dB tolerance. That’s studio control room level tolerance. We also see Focus Fidelity’s response is more filled in below 100 Hz and I chose the 40 Hz cutoff point. Finally, I tilted the high frequency tonal response to be a bit less bright than what comes out of the box with ARC 3.
Don’t get me wrong, ARC 3 is a significant improvement over the uncorrected response, but the bass still sounded a bit “one note” to me and some of that “boxy” sound was still evident. Plus just a little too bright for my personal taste. But way better than the uncorrected response. I know I could dial in a -2 dB shelf on the speaker itself, but I wanted more of a tilt than a shelf.
The iLoud MTM are “good” desktop loudspeakers out of the box, with many technology features, including impressive low frequency response for their size. They sound “better” with ARC 3 calibration. But sound “best” with Focus Fidelity correction filters.
Subjective Listening Impressions
Low-end frequency response is important to me as I mostly listen to rock, alt, blues, R&B, etc., where there are drums and bass with significant energy in the low frequencies. It does not sound right listening to rock music on desktop speakers that are missing the low frequencies. I have tried adding a sub under the desk, but it always sounded disconnected to me unless I went multichannel and time aligned the sub, but that’s more complexity than I want.
 Sitting in front of the system listening to Madonna’s Drowned World – Substitute for Love. After a couple of flips between no filter and Focus Fidelity’s newly minted filter, that was that. Unlistenable with no filter.
I mean no surprise as that huge 10 dB SPL peak at 135 Hz means that frequency is perceived to be twice as loud to our ears as compared to adjacent bass frequencies. This is our “coke bottle” resonance on full display for our ears to hear, which gives it that “one note” bass tone. Ugh. The peaks at 325 and 425 Hz is what gives the “boxy” sound.
My immediate reaction is how incredibly “big” the speaker’s sound. It is a bit of a shocker. You can just feel the low bass waves at reference level. The speakers disappear and the image is outside of the speakers. Closing my eyes literally sounds to my ears that the desk and monitor are not in front of me. There are no audible discontinuities in the 3D image. The 3D image extends well above, below the desk and back from the speakers. It is quite the illusion to hear. Even at low volumes, remains intact.
 Cranking up Patricia Barber’s Regular Pleasures with the drop tone bass drum really gives a workout. The bass is big and concussive and shakes the desk solidly. I can hear the rear ports on the MTM’s just starting to reach maximum velocity (i.e. chuffing sound) at 83 dB SPL reference level. No clipping yet. Clicking in the 50 Hz HPF gives reprieve and can be turned up louder. And for much louder than I care to listen to, one can select the 60 Hz HPF and run twice as loud as reference (i.e. 93 dB SPL) with still solid bass and not clipping the 100 watt amps.
Side note; these speakers do not hiss or hum like some of the other desktops I tried. I can hear a faint hiss/hum with my ear right up against the speaker. But silent 38” away. I am using an unbalanced output from my Topping E30 into the MTM’s. The MTM’s do provide a balanced input if your gear has balanced line outs.
The one thing that is not as measurable is how the bass quality sounds. Some DSP/DRC products I have tested in the past have definitely smoothed the response, but sucked the life out of the bass. Subjectively I would use words like anemic or amorphic or blurry to subjectively describe the bass sound quality. I believe this is a result of both magnitude “overcorrection” and not dealing with the low frequency time domain of the room.
Fortunately, Focus filters have none of these issues. The bass is dynamic yet smooth, well defined and crystal clear. The soundstage is larger than I anticipated. The MTM design coupled with Focus Fidelity DSP throws quite the sound field. I am more used to that size image from my large JBL’s, not these little desktop speakers. Impressive.
 The eval would not be complete without some SRV in the room. Tin Pan Alley is one of SRV’s tunes that captures him and the band during a first take warmup. The performance with the band dynamics, and a DR 18 dynamic range, makes for a wild roller-coaster blues ride. The drums and bass sound punchy, the guitar slinks, rips and cries. SRV’s voice through a classic Shure 57 sounds like he lives in Tin Pan Alley. “The roughest place I have even been.”
The “live off the warehouse floor” performance is a once in a lifetime recording that one can listen to at any time. I got totally lost in the music forgetting about the eval. Enough said.
Conclusion:
It has been a fun experience using Focus Fidelity’s Filter Designer. It is pretty easy to use and provides full user control for the parameters required to design and generate a custom filter to work with one’s speakers in one’s room. This is important as some other DSP/DRC products don’t even provide the capability to adjust how much correction is applied.
Getting desktop speakers to sound good is hard. There are many obstacles, the main one being the desk that the speakers are on. Even raising the speakers off the desk or just behind the desk on stands, still have the desk to contend with between you and the speakers. I tried both of these approaches and looking back at some of my earlier measurements, can produce even wilder swings in the low frequency response.
While the ARC 3 room correction system that comes with the MTM’s does a good job, Focus Fidelity Filter Designer is state of the art. Measuring the speakers with the Focus Fidelity filters in place produced the smoothest frequency response and best timing response. Virtually textbook perfect in restoring the ideal minimum phase response of the speakers in the listening area.
For $250 I can’t think of any other audio product, h/w or s/w that will audibly improve the sound quality and one’s listening pleasure. For sure there is a learning curve, one has to acquire a measurement microphone ($100), mic stand ($50). And with some patience in taking measurements and working through Focus Fidelity’s help file or my walkthrough here, the end result is accurate sound.
I went from OMG; this sounds awful to sounds pretty dang good. If you have never heard a properly DSP corrected desktop system, you’re in for a real treat. It is a joy to switch between my desktop system and my large living room (calibrated) system and hear the same tonal response. For sure, the desktop system can’t play anywhere near as loud as my main system, but for background listening and even critical listening, sounds pretty good when I need to be at the desk programming for hours.
While I am biased, I can’t imagine listening to speakers that have not been frequency and time domain corrected to match to ones listening environment perfectly.
An auspicious beginning for a DSP newcomer on the market. David will be adding a measurement module to his software, digital crossovers, bass management and multiple subwoofer optimization. I am looking forward to trying these features as my main system would take advantage of all of these features.
I hope everyone is staying healthy/safe and enjoying the music!
More info at the Focus Fidelity site - https://focusfidelity.com
 Mitch “Mitchco” Barnett.
I love music and audio. I grew up with music around me, as my mom was a piano player (swing) and my dad was an audiophile (jazz). My hobby is building speakers, amps, preamps, etc., and I still DIY today.
I mixed live sound for a variety of bands, which led to working full-time in multiple 24-track recording studios. Over 10 years, I recorded, mixed, and sometimes produced over 30 albums. I wrote a book on, “Accurate Sound Reproduction using DSP” and run an Accurate Sound Calibration service.


Recommended Comments
Create an account or sign in to comment
You need to be a member in order to leave a comment
Create an account
Sign up for a new account in our community. It's easy!
Register a new accountSign in
Already have an account? Sign in here.
Sign In Now