

In this article, I walk through the steps of using Audiolense 5.0 (AL5) to biamp my loudspeakers using a linear phase digital crossover. Followed by frequency and time domain correction, so the frequency response is tonally neutral and the direct sound is arriving at my ears all at the same time. Listening sessions and measurements provide feedback to optimize “room correction” and “partial correction.” Filter design verification measurements are provided.
 As a preview, Bernt Rønningsbakk, the author of Audiolense, has really hit it out of the park with his latest version. This is a significant improvement over AL4, which I have written a few blog posts here on CA. The core algorithms have been rewritten along with several enhancements, (see what’s new in AL5), in which I take full advantage of in this article.
Audiolense is offered in three different versions: 2.0, which offers frequency correction; Surround, which offers frequency correction and time alignment of all speakers and includes a basic crossover for bass management; XO which includes True Time Domain (TTD) correction that fully synchronizes the first arrival for all frequencies and all speakers involved, plus a fully configurable digital crossover. The XO version (~$500 US) is what I used for this article. AL5 demo can be downloaded and provides the ability to listen to 90 seconds of correction over your system.
The Gear

I love high efficiency loudspeakers for their perceived dynamics. These 2-way JBL 4722 cinema loudspeakers are about as sensitive as one can get, rated at 104 dB SPL at 2.83 volts at one meter. I selected the biamp version and performed a compression driver upgrade, as suggested by user notnyt on the AVSforum. The 4722’s are fugly looking, but sound huge. Note one can use Audiolense with any passive speaker or virtually any loudspeaker for that matter, including surround sound systems.
While there are differing opinions on Class D amps, I have been impressed by the Crown XLS DriveCore 2 series of pro amplifiers. I use a XLS 1502 that is rated 525 watts per channel into a 4 ohm load, which is what the JBL double 15” bass cabs are wired for. Coupled with a damping factor of 200 at low frequencies, the bass punches at any volume level.
Above 630 Hz, the JBL 2453H-SL compression drivers are fed by Nelson Pass Class A single ended mosfet ACA kits that I assembled. Nelson’s “mu follower” sounds highly detailed, but never harsh. It’s a great match to a high sensitivity compression driver, as the amp has 14 dB of voltage gain so a resistive “pad” is not required to match the sensitivity level to the woofers, which are fed by a much higher gain amp, (e.g. 26 dB of voltage gain), like the Crown for example. What this means is there is no speaker attenuation nor any digital or analog attenuation. In my system, the amps are wide open, as are the analog outputs of the Lynx Hilo feeding these amps. Both amps are quiet, with a small amount of hiss when ones ear is pressed right up against the speakers.
I use a Lynx Hilo AD/DA converter as I find great versatility in its uses and its transparent sound quality. JRiver MC 23 64bit Edition, which I find 15 to 30% faster in operation than the 32bit version, with the same sound quality. JRiver’s convolution engine to host the AL5 designed and generated FIR filters, plus JRiver’s 64bit internal volume control. JRiver’s variable loudness control with reference level set ~83 dB SPL at the listening position with volume protection enabled.
Perspective on Why Digital Loudspeaker and Room Correction
One of the reasons I posted what gear I use is to illustrate that everyone’s sound reproduction system components, including loudspeakers, and for sure, room acoustics, are different. However, the division of sound reproduction inaccuracy clearly errors on the side of loudspeakers in rooms. Especially compared to measurements of DAC’s and amplifiers which, if properly designed, have flat frequency responses, flat group delay and phase responses, with perfect step responses, and virtually no distortion.
Loudspeakers in rooms’ measure significantly worse in every aspect, and typically by orders of magnitude worse, as compared to its electrical counterparts. Simply getting 20 Hz to 20 kHz out of a loudspeaker in a room to ones ears within 0.25 dB tolerance is virtually impossible, even at a single point in space, but that tight tolerance is a commodity in almost all DAC’s and amps. For example, here are the measured frequency/phase response, and group delay of my Lynx Hilo, using analog loopback. Meaning, I am measuring both the I/O line amplifiers along with the AD /DA conversion:


Have a look at speakers timing responses (i.e. step response) and compare to the ideal step response of a loudspeaker (scroll down to the section on Time Coherence – Step Response). Looking at the loudspeaker step response measurements in the Stereophile article, and the ideal step response linked, one can see the timing distortion in most speakers isn’t remotely close to ideal. In fact, wildly distorted. Loudspeakers in rooms are the biggest offenders in distorting the frequency and timing response of the acoustic signal arriving at ones ears, again by orders of magnitude, as compared to upstream components.
Audiolense is a state of the art, custom digital FIR filter designer that allows one to correct the frequency and timing response of your loudspeakers, in your room, so that the frequency and timing response arriving at ones ears is much closer to its electrical counter parts, and therefore more accurate or transparent sound reproduction. You will see measured smooth frequency response with flat group delay and phase response at ones ears in this article. Basically, the same frequency and timing response that is coming out of an amplifier, or as close as possible as one can get with an electroacoustic transducer in an acoustic environment. Folks may be surprised to learn how close one can get to exactly reproducing the audio signal that is encoded on digital media to ones ears at the listening position.
Do no harm. The purpose of Audiolense is to undo the harm to the audio signal, introduced by loudspeakers in rooms, arriving at your ears at the listening position. This optimizes gear investment and maximizes musical listening experience on how good ones existing gear can sound. Think of it as a restorative process. Let’s get started.
Configuring Audiolense
At the end of the article is Bernt’s PDF help file for AL5. I am not going to cover the basics of measurement mic and preamp selection or how to set up for taking measurements. This is covered in the help file and in several articles and posts here on CA. The only reminder is make sure ones measurement microphone is calibrated.
After launching Audiolense, select New Speaker Setup:

Give it a setup name and in my case, it is a stereo setup, so I have selected 2.0 configuration from the dropdown list. Click OK:

We want AllInOne measurement group and FullRange speaker type, if not already set. In my case, I am using AL5’s digital crossover, so I click on the Cross Over Configuration tab (note this step can be skipped if not using digital XO):

Double clicking on each speaker row will enable a two way (i.e. biamp) configuration. Here I have set the crossover frequency to be 630 Hz, as recommended by JBL.
I went with the default 2.0 Fixed XO Width – octaves setting. Click on Save Setup.
The main screen shows the newly designed digital XO:

Note the steep slopes. It is worth reading Bernt’s help file (attached) if interested in the audible impact crossover frequency and slope rates can have on one’s loudspeakers.
All set. Before taking any measurements, make sure your microphone calibration file is loaded.
Taking Measurements
From the Measurement menu, select New Measurement:

The first thing to realize is the Channel Output order. In my Lynx Hilo setup, Channels 1 and 2 are for bass left and right, Channels 3 and 4 are for tweeters left and right. From the Advanced Settings menu, select, “Output channel override” so that it is enabled:

Back on the measurement screen, I can now reassign the output channels, which start at 0 instead of 1 on my Lynx Hilo, to match. Meaning, 0 and 1 are bass left and right, 2 and 3 are tweeters left and right respectively. Note I have already done so in the measurement window above.
See the ![]() on the measurement screen? This controls the output level of the test tone (i.e. sweep). One may want to start at -40 dB or -30 dB, so that the volume is down in level to prevent both speaker and hearing damage. Once through the procedure below, and after the first measurement, it should be safe to turn up the output to the desired level.
on the measurement screen? This controls the output level of the test tone (i.e. sweep). One may want to start at -40 dB or -30 dB, so that the volume is down in level to prevent both speaker and hearing damage. Once through the procedure below, and after the first measurement, it should be safe to turn up the output to the desired level.
We can see the sweep range is set from 20 Hz to 24 kHz, but split between the two way digital XO with overlap, as determined by the width of the digital XO as per cross over configuration settings.
I leave the “apply 10 dB attenuation for tweeters” checked to save on ears and tweeters. Also, go with the default sample rate of 48 kHz.
The next step is to Check Speaker Connections, this allows one to verify that the channel routing is working correctly and that the test signal is going to the correct speaker and driver combination. E.g. the low frequencies are indeed going to the woofers and not the tweeters. Click on Check Speaker Connections:

Click on Test Connection and once you hear the sound coming out of the correct speaker/driver combination, click on Connection is OK and continue with each driver until completed. So either it all passed, or one needs to go back and adjust the channel routing to ensure the signal is getting to the correct driver.
Click on Run Measurement. Note with the “Notification and 10 seconds pause when recording” is checked, a dialog box will pop up to acknowledge, so one has time to get out of the way of the speakers and mic. For the first try, I am in a positon to quickly cancel the measurement if it is excessively loud. Optionally, if one has a sound level meter, adjusting the output to around 83 dB SPL C weighting at the mic position during the sweep is ideal, but not required.
Once the test signal has completed, a dialog box opens with a Measurement Quality Report:

What one is aiming for is a clean measurement with good or excellent dynamic range. This is very important as the filter design is based on the quality of the measurement (or multi seat measurements). It may take a few tries to optimize a good dynamic range by increasing the output level of the test signal through the speakers (but not excessively loud) and/or adjusting the microphone preamplifier gain. Click OK when complete.
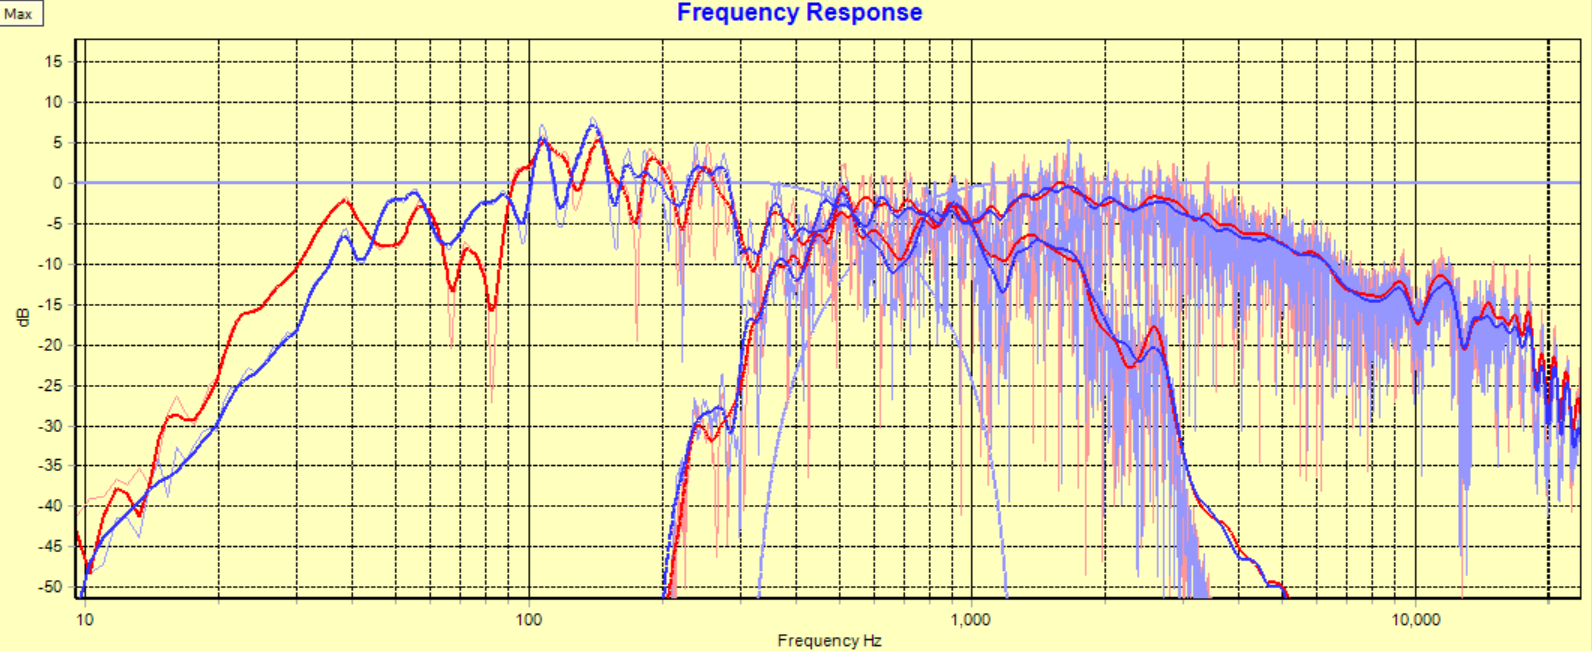
Click on View Measurement, if it is not already showing. Here is what mine looks like, zoomed in a bit by putting the mouse cursor to the top left, clicking and dragging to the bottom right and letting go. I have left the XO in the view as well:

This is both left and right speakers with corresponding woofers and tweeters in a biamp setup. As can be seen, some low frequency trouble at around 70 Hz and high frequency anomalies around 12 kHz. The former is likely a low frequency room reflection or two. The latter is a common result of using large format compression drivers. However, both are important to note as we will revisit these in the fine tuning section.
If happy with the measurement, the mic can be taken down and put away if one is not concerned about validating the final result. I will say that AL5’s simulations compared to actual measures are dead on. For the purposes of this article, I left the mic up, as I wanted to verify the results and show some comparisons between filters. I am able to setup for measurements, take measurements, create filters, and validate the filter designs for this article, all in under one hour. Took a few tries though…
Measured Driver Delays
As a side note, eagle eye folks may have noticed there is a delay value now filled in after taking the measurement:

What this means is that relative to the tweeter’s acoustic center, the woofer’s acoustic center is delayed by .69 and .71 milliseconds respectively. But wait a minute, given that the compression driver, on the back of the JBL 2384 waveguide, is further back then the woofers, how can the woofers be this delayed behind the compression driver? What is the cause of the delay? It turns out the Crown XLS amp has on-board DSP that is engaged, even though it is in bypass mode, is the cause of the delay. Without this amp’s DSP delay, the woofers would need to be delayed, roughly by 30 samples at 48 kHz, to be lined up with the acoustic center of the compression driver.
Now that we have a quality measurement, let’s start designing our custom FIR filter.
Design a Filter – Correction Procedure Designer
From the Correction menu, select Correction Procedure Designer:

I would advise at this point to have a look in Bernt’s help file and read the section on Correction Procedure Designer, how it works, and the three default procedures. It may take a few reads to understand what is happening, like True Time Domain correction:
“The True Time Domain correction cleans up the impulse response in the time domain and corrects the speakers towards the time domain behavior in the target. A good frequency correction goes a long way, but usually time domain correction improves the sound quality even further. In most setups, a true time domain correction will provide better perceived dynamics, 3D and air than the alternative.
When True Time Domain Correction is checked, the whole speaker will be time domain corrected as one single entity. This is the only TTD option for passive speakers. The option “TTD Correction per driver” will also be visible when digital crossovers are used. Checking this option will also time domain correct each driver individually before the speaker is assembled and corrected as a whole.”
Keep the first sentence on TTD in mind when we get to designing the target response.
In my case above, I have clicked on New Procedure, gave it a name, and now ready to design my own custom digital filter. Note which checkboxes are checked.
As described in help file, I leave the measurement and correction window default values. I also have selective preringing prevention checked. Refer to the help file for what it does and when to use it. Personally, except at gross levels of preringing far above what is in a typical time domain correction filter, I never hear any preringing artifacts.
First, let’s try a shorter time correction window in the bass, so now I have 2 cycle window both in the low and high frequencies as entered in the True Time Domain Subwindow:

Click Exit.
Design a Filter – Filtering the Measurement
On the main screen, click on Filter measurement button. This will bring up which filter procedure to apply. Choose the procedure that we just custom designed in the Correction Procedure Designer and click OK. Here I have zoomed in the result and left the raw measurement to show what the filtering does:
A frequency smoothing based on psycho-acoustic principles leads to a smoothed response that sits high in the comb filter region and avoids overcorrection of dips.
The measurement & correction window helps smooth the filtered measurement in the frequency domain and determines how much time the correction filter is given to complete the job.
The settings also affect how the frequency response is smoothed before it is corrected. The Time Domain Window (TDW) is used together with other methods to smooth the frequency response. The ultimate goal of the procedure is to obtain a smoothed response that correlates well with what we hear and what we would want to correct. As can be seen above, even without the XO join of the low and high frequency sections, not the smoothest frequency response. Especially when compared to the frequency response of my Lynx Hilo above.
Remember the time delay between drivers? Let’s look at the measured step response by switching to the chart impulse view and selecting from the Analysis menu, Measurement and Step Response Measurement:


Here I have zoomed in on the first 10 milliseconds. While not an integrated view of the step response, one can see that the sharp spike is the tweeter (i.e. compression driver) followed by the woofer. Whether one is looking at the two peaks, or the start of each step, clearly, these drivers are not time aligned The tweeter will arrive at ones ears first, then followed by the woofer, .69ms left and .71ms right later. It should go without saying that no amount of eq can fix a time alignment problem.
I have been playing with this type of FIR DSP since 2011 and to my ears, in multi-driver systems, time aligned drivers sound best. Scroll to section “Time Coherence – Step Response” for a detailed explanation. In AL5 it is a snap as it is fully automated in the software, and as we will see, seamless time alignment of the woofers to the tweeters, even though there is ~ 8 inches of z offset between the drivers.
With both the frequency and time domain measurements completed, we can see that both are not ideal. Let’s move on to designing a target response.
Design a Filter – Target Design
If one is interested in various frequency response targets that listeners prefer, have a read of Dr. Floyd Toole’s excellent AES open access paper on The Measurement and Calibration of Sound Reproducing Systems. See Figure 14 on page 17, the subjectively preferred steady-state room curve targets in a typical domestic listening room:

I prefer the “trained listener’s” room curve. However, I urge folks to try out different target curves to find ones preference. In AL5, it is simple to make multiple target curves, generate the filters and be AB’ing in a matter of minutes. Target or room curves have a substantial audible impact to the timbre (i.e. tone quality) of ones sound reproduction system. Experimenting with different target or room curves is well worth the effort.
In the main screen, click on New Target:

Use the mouse to click additional target points on the graph so as to draw the target to the spec. As mentioned above, target design is quite critical to the overall timbre (i.e. tone quality) and worth the time to play around with different slopes. Some folks like a bit of a bass bump, there is no right or wrong, simply what one prefers.
However, trying the spec’d target to start with generally results in a perceived neutral tonal response to ones ears at the listening position. A good reference point before departure. Here is the finished result:

This is a minimum phase target. I also created a linear phase target using the exact same target design. Linear phase correction will correct towards linear phase behavior where all frequencies arrive at the listener at the same time with the same phase. AL5 can design mixed phase targets as well. I recommend spending time reading Bernt’s help file as there are many variables to consider in target design, which have an audible impact on tone quality. As an initial starting point, tracing the low and high frequency roll off of the drivers is time well spent.
Here is another popular target, rather than a tilt, it is flat out to 1 kHz and using 1 kHz as a hinge point, straight line to -6 or -7 dB or so at 20 kHz, depending on how much high frequency energy ones ears can take:

Small variations in targets will impart a certain perceived timbre or tone quality. The tilting target, before this one, will have a bit of a recessed midrange, whereas flat to 1 kHz, the midrange will be a bit more out front. Again, worth creating a few targets and switching between to determine ones preference. For the purpose of this article, I went with the tilted target, but later listened to the flat to 1 kHz linear phase target.
Click on Save when happy with your target design. One may revisit tweaking a target response several times during this workflow. A good naming convention goes a long ways to staying organized.
Design a Filter – Filter Generation and Verification
In the main window, click on Generate Correction Filter. In the main window, one should now see:

We are looking at everything sans the original measurement. It is good to just look at the correction filter first to see if there are any anomalies. Here I unchecked everything in the main window, chart view details, except the correction:

Looks good. Keep an eye on low and high frequency boost at the frequency extremes as this can lower (i.e. attenuate) the overall level of your correction filter by -10 dB. Additionally, we will revisit the high frequency correction in the fine tuning section on partial correction.
OK let’s look at the simulated frequency response by unchecking everything but the simulated response and target:

Looks pretty good and follows the target precisely until the frequency extremes. The -3 dB points are 25 Hz left speaker and 35 Hz right speaker. The reason is my stereo is offset to one side of the room where the left speaker is more in the corner and benefitting from that boundary position, whereas the right speaker is almost center line of the room and in just about the worst position possible. 19 kHz is the -3 dB HF point with these large format compression drivers. Not that I can hear that anyway, but they sure sound smooth.
Now let’s look at the predicted or simulated timing (i.e. step) response as it would be at the listening position. To do this, uncheck all items in the main window, chart view details. Then in the bottom left hand corner, chart view, click on Impulse response. Then from the Analysis menu, select:

On the main chart, you will see the new plot. It will take a couple of “mouse click top left, hold and release right bottom” zooms to get to this level – note the horizontal scale in milliseconds. We want to see the first 20ms, with the first 5ms being the most important to see that “right triangle” shape of a time aligned step response, and following the minimum phase roll off of the loudspeaker in the low end.

Looks good. No preringing at the beginning of the vertical step with no discontinuities in the vertical step, meaning that all frequencies are arriving at ones ears at the same time. This is much closer to an ideal speaker’s step response and a major improvement over the measured step response in the previous “Filter the measurement” section. For a refresher on what an ideal speaker’s step response should look like, scroll to section “Time Coherence – Step Response”
Without changing anything else, here is the step response, using the exact same target response, but now with a linear phase target:

Looking a bit different and audibly, sounding subtlety different. Once we get into the listening sessions, I will indicate my preference. Either way, good looking step responses. I should point out that the corresponding frequency responses to the two different step responses are identical.
The next step on the main screen is to click on Save Filter. This opens a dialog to save a .cfg file that contains the path names to correction wav files. Once you choose the save location and give the file a descriptive name, it will be followed with another dialog on which sample rates one wants to generate.
Don’t see the sample rates you need in the list? Cancel out and go under the Setup menu, select Optional Sampling Frequencies, enter in the sampling frequency you wish and add. Then repeat the save filter and now checkbox the sampling frequency that one just created.
In my case, I am using JRiver and in the convolution window, select browse and load the .cfg file and now ready to listen. No editing of the .cfg is required. Please refer to Bernt’s PDF help file for details or check out other articles and blog posting on CA for details on how to load .cfg files into JRiver’s Convolver.
Let’s give it a listen and make a few unnecessary validation measurements.
Listening Sessions and Measurement Verification
Listening Sessions
I wish folks could hear it. With those big fugly speakers, the experience is immersive 3D imaging. The depth of field is a real treat. It is almost if one can fall into the mix. And certainly belies having a 42” LCD display parked between the speakers. Closing my eyes, and as far as the audio presentation is concerned, it simply is transparent, as if the LCD screen does not exist. In fact, measuring the ETC with REW shows any reflections off the LCD screen to be below audible levels using Dr. Toole’s psychoacoustic research as reference.
I critically listen at ~83 dB SPL C weighing, slow metering, give or take a bunch of dB’s depending on how over compressed the music material is. SRV gets cranked up. Oasis, turn that down! ☺
What do I listen for? Point source sound. Meaning if the stereo were playing mono material, ones perception of the sound should appear to be emanating from a point directly between the speakers, centralized at ear height. With the correction in place, the left and right responses are almost identical, both in the frequency and time domains. So not only is the sonic reproduction neutral and time aligned, any loudspeaker and room discontinuities between left and right channels are accounted for as well. Literally a mirror image.
From a stereo perspective, the phantom center image should be dead center and not waver with frequency. Given the mirror image, stereo reproduction should be properly decoded to again closer represent the waveforms as encoded on the digital media. Many years ago when I recorded and mixed on time aligned monitors, every instrument had their placement, not only from a stereo perspective, but also depth of field. Using the Haas effect, digital delays and reverbs, one could make a band sound like they were recorded in a small club all the way up to a stadium gig.
For timbre, can I hear preringing before the attack of the main sound? Does the tone quality sound neutral? Meaning, no one frequency or range stands out, or not too bright or dark sounding on a wide range of recorded material. Do the s’sss sound natural on the voice? Overly sibilant? Or sounds like shhh? Bass notes sound distinct? Some bass notes are louder? Softer? Etc.
One of my favorite tunes to crank up is Stevie Ray Vaughn’s Tin Pan Alley (DR 18) and hearing the snares rattle with the bass guitar cab along with the ambience feels like being in the concert hall with the band playing live. Same with Cream Live in 2005, you’re in the best seat in the house, at the mixing console!
Another test I perform is recording my acoustic guitar with the measurement mic and then playback the recording, and play along. It becomes clear quickly if the timbre is off in any way. Oh the other hand, it is amazing how close to the real thing it sounds, right down to the finger noise on the strings. I also have electric and bass guitars, and if you look in the picture at the beginning of the article, an acoustic drum set that I play along with the stereo. It’s nice to have speakers that can keep up with a live kit that sounds good, with low distortion.
I am liking the sound at this stage and do have a couple of comments related to the trouble areas mentioned in the measurement section where there is some room disturbances around 70 Hz and the top end needs some consideration. But I will hold off until the fine tuning sections as I establish a baseline of the current filter design. With that in mind, let’s take some measurements with the correction FIR filter in the circuit.
Measurement Verification
Here I measure at the listening position using John Mulcahy’s REW shareware acoustics program. At the outset, I want to say that Bernt’s simulations are virtually identical to the measurements.
The measurement path is, test tone output of REW is digitally routed through the Lynx Hilo to JRiver’s ASIO digital input, with no digital attenuation, passed through the Convolution engine, hosting the Audiolense digital XO and FIR correction filters, and then routed through the Hilo with no digital or analog attenuation to the 4 amplifiers, to stereo biamp speakers, to the mic at the listening position, through the microphone preamp, into the Hilo ADC and then routed to the digital input of REW, calculations performed and finally displayed on a graph.
Here is the “unsmoothed” or full resolution measured frequency response at the listening position:

Our ears don’t “perceive” that level of comb filtering, as displayed in this high resolution plot. Our ears perceive more of the envelope of the waveform, rather than every narrow rise and dip in the response. Our ears are more sensitive to peaks than dips.
Traditionally, 1/6th octave smoothing is used to visually smooth the envelope to approximate what our ears would perceive. Today we have frequency dependent windowing (FDW) and psychoacoustic filtering. However, this level of technical detail is out of scope for this article. 1/6th octave smoothing is close enough for our illustrative purpose and is a reasonable graphic representation of what our ears perceive.
Here is the same measured response, but with 1/6 octave smoothing:

This matches very well with the AL5 simulated frequency response, including the same -3 dB points. The measured tilted response is perceived as neutral to our ears at the listening position. For fun, I suggest folks try a flat 20 to 20 kHz target and compare to this one by AB testing in near real-time like in JRiver.
While not as flat as an amplifier’s frequency response, factoring in the tilt, it is much smoother than the filtered measurement and within a much tighter tolerance. Sounds really smooth to my ears. No one frequency stands out, sounds neutral.
Now the timing (step) response:

If you scroll up and look at the AL5 simulated step response, using the minimum phase target, and compare, they are pretty much identical. I did not bother to show the linear phase target, as it is also identical to the AL5 simulated step response.
So frequency and timing response verified as it matches perfectly with AL5’s simulated responses. Furthermore, looking back near the beginning of the article and comparing to the uncorrected frequency and step response, one can see a major improvement. Sounds that way too.
While I don’t show it in this article, my eBook shows that smooth frequency response and time alignment is valid at more than one mic position. I show 14 measurements of both frequency and timing responses are virtually identical around a 6’ x 2’ grid area that represents my 6 foot, three seat couch listening area. No matter where I sit on the couch, the sound is time aligned, and there is very little tone quality difference moving from seat to seat. I don’t hear any “phasiness” or comb filtering, when I move around, sounds virtually the same.
However, controlled or constant directivity waveguides bring another challenge as the waveguide requires constant directivity horn equalization, but the compression driver already has phase plug correction built in. Applying a correction on top of a correction sounds, you guessed it, overcorrected.
Overcorrected high frequency response tends to sound too compressed or processed. Another giveaway is moving ones head from side to side at the listening position and the center image tracks to one side of the speaker, instead of pivoting around the center phantom image. This is another sign of HF over correction. This is one area of interest for the fine tuning section below.
The other area to revisit is that frequency response dip around 70 Hz. That is “room correction” territory and will be first up in the fine tuning section.
Fine Tuning Tips and Tricks
Room Correction
My stereo is offset to one side of the room and firing across the short width of a 30’ x 16’ x 8’ room. This is going to cause low frequency reflections, which has an impact on the sound quality I am listening to. It is not obvious at first, unless one has heard it before, and verified with measurements, then what reference does one have to compare to?
What to listen for? One giveaway is that certain bass note frequencies sound different, usually not as loud and/or focused. When listening to a bass response that has no room reflections interfering with the low frequency response, one notices that every bass note emanates from one point in space between the speakers, sounds solid as every note is distinct and does not vary in perceived loudness. You only have to hear it once to learn what it sounds like, but where to hear it?
Another way to look at the time domain of a sound reproduction system, is group delay. A linear phase system’s group delay is constant, meaning a flat response. Flat group delay also means a flat phase response. Btw, so should a well-designed DAC and amp measure both flat group delay and phase response. See the Lynx Hilo measurement of group delay and phase near the beginning of the article.
There is some consideration for a slowly rising group delay at the lowest frequencies, as this is the group delay introduced by the ideal loudspeakers minimum phase response, as speakers do not reproduce down to DC (i.e. 0 Hz). However, in my example, there are a couple of non-minimum phase room refection’s that are audibly changing the group delay (and phase) at the listening position. John Mulcahy, REW author, has a good write up on minimum phase.
Let’s look at the group delay in the same measurement as above:

We can clearly see group delay at 50 Hz on the left speaker and 65 Hz on the right speaker. Again, because the speakers are offset left from center of room. If I could set up the speakers to be perfectly symmetrical on either side of the center line in the room, the group delay would still be present, but at the same frequencies.
How to get rid of it or reduce it, or restore to flat response? If you read John’s article on minimum phase linked above, one will read that it cannot be corrected with eq. I agree. Here what we need to do is fix the time domain response in the room. This is easily done in AL5 by increasing the TTD window size in the bass frequencies, via the Correction Procedure Designer, and rerun the correction, leaving everything else the same. We are only changing one parameter. So instead of a 200 ms correction TTD window starting at 10 Hz, let’s try a 500 ms correction window by entering 5 cycles at 10 Hz:

In the True Time Domain Subwindow we went from 2 to 5 cycles of time correction at 10 Hz. The idea is that we increase the correction window size to envelope the non-minimum phase reflections in the bass. The impulse inside the TTD window is corrected towards the time domain behavior of the target response.
Exiting, regenerating the filters using the same target curve, and all other settings the same, and re-measure, we get:

We can see the two major group delay issues at 50 Hz and 65 Hz are now gone. We see the slope of the group delay rising as it reaches lower frequencies as it follows the minimum phase response of the target. The only thing I changed was increasing the amount of low frequency time domain correction.
Once ones ear’s tune into how solid and stable the bass sounds at any low frequency and sits “right in the pocket”, you won’t be going back.
There are multiple ways of dealing with low frequency room issues below Schroeder frequency, like multiple subs (that need to be time aligned IMHO) or a roomful of bass traps, however, both solutions also alter the frequency response. That’s what’s cool about the power and sophistication of today’s DSP software, it can surgically remove low frequency room reflections, yet the measured frequency response stays the same. Here is the frequency response from the two measurement runs of TTD settings 2 and 2, and 5 and 2 cycles, overlaid from 20 to 100 Hz:

One can see the left and right pair’s frequency response is virtually identical. Overlaying the same measures, but change the view to group delay:

This shows the effectiveness of “room correction” in action by reducing group delay independently of frequency response. Here we are seeing the group delay being reduced by over 30 milliseconds at 50 Hz and 65 Hz respectively.
If one wants to lower the group delay even further, using a linear phase target will assist. Here is the group delay measurement using the same target response as above, but now a linear phase target:

And for fun, corresponding phase response:

While not perfectly flat like the Lynx Hilo, for a loudspeaker in a room, at the listening position, considerably better than without correction. As shown in my eBook, I was able to measure mostly flat group delay and phase throughout the 6’ x 2’ listening area, so again, it is just not at a single mic position.
We can see in addition to a perceptually smooth and neutral, and time aligned response, we can also achieve a relatively flat group delay and phase response arriving at ones ears at the listening position.
Note that it varies from system to system how close you can get to a perfect time domain behavior. In another living room with less benign acoustics, an attempt to remove the group delay peaks may be ignored (when the selective pre-ringing prevention is engaged) or lead to more than desirable pre-ringing. Sometimes these time domain anomalies are practically uncorrectable although it can be done mathematically. AL5 has been designed to enable the advanced user to dial in the best possible compromise in his/her own listening environment
There is controversy over the audibility of group delay at low frequencies, as the current research does not take into consideration frequencies below 500 Hz. Here we are discussing frequencies below 100 Hz. For music, that has a range of bass frequency notes, I can AB the difference every time, as I know what to listen for and prefer the bass without low frequency room reflections (i.e. non-minimum phase behavior).
I agree that non-minimum phase behavior cannot be equalized in the frequency domain, however, as my measurements bear out, it certainly can be removed in the time domain. Sounds amazing to my ears as I only experienced this type of low frequency response previously in acoustically designed control rooms at recording studios.
As a side note, I hope audio manufacturers and/or industry society’s, sponsor more blind or double blind listening tests on the audibility of speaker time alignment and group delay below 100 Hz. Given the power of today’s computers and sophisticated audio DSP software, which was not available a decade ago, it would be good to update the research.
At this stage, I am happy with the timing of the bass response of my system. Now to move on to high frequency tweaking.
Partial Correction
Partial correction is great if one just wants to correct frequency and timing response independently up to a certain frequency. Like Schroeder or whatever, you choose. As mentioned in the section, Listening Sessions and Measurement Verification, I pointed out the waveguide requires frequency compensation due to its design, but the compression drivers high frequency response already has been optimized (i.e. corrected) using a phase plug to extend its high frequency response.
This is a point of departure depending on one’s gear and goals. More often than not, the natural extension of the driver, and in this case, a large format compression driver, typically sounds more relaxed and not compressed or processed.
From the Correction menu, select the Correction Procedure Designer again. Don’t forget to select the right Procedure Name in the drop down before proceeding to making any changes.
Here I have already clicked on Partial Correction checkbox in the Designer and then clicked on the Partial Correction tab:

I have entered a full frequency correction for waveguide compensation, but up to 5 kHz time domain correction. Above 5 kHz, it is the natural time domain response of the compression driver. Note that I have left “use target as EQ in no correction zone” unchecked.
Then one exits, regenerates the correction filters, save and load into JRiver and give a listen. Takes a couple of minutes to do so and one can be listening and AB comparing to a previous filter, in near-real time.
As before, here is the new correction filter response based on the partial correction:

Now here is the same correction, nothing else has changed, but with partial correction turned off:

Compare the two correction filters past 10 kHz. To my ears, a little more “relaxed” high frequency response due to the “quieter” filter. I am letting the phase plug in the compression driver use its own time domain correction as opposed to adding on top of it.
Now when I move around on the couch, the stereo phantom center stays anchored in the center and my ears are pivoting around it as opposed to phantom center moving to one side of the speaker as my head moves.
This really is fine tuning one’s high frequency preference, not only target slope or tilt, but also how much high frequency and time domain correction is or is not required. It is worth spending a bit of time playing with partial correction to get a sense of what it does and what you prefer. In some cases with dome tweeters with excellent minimum phase response, one may prefer the full TTD correction.
And with that final tweak, I am happy with the end result. As an update, I have been listening for four days and feel no need to make any further adjustments. I was going to use the global tilt control in the Target Designer to tilt the overall target or room curve a little more downward, as I initially thought the sound reproduction was a little too bright. After extended listening to a wide range of music and movie material, I am still happy with the original result. However, I must admit, I did go back to the flat to 1 kHz linear phase target, which I have been listening to for a number of years. Currently listening to it now.
Conclusion
The AL5 XO version that I used is approximately $500 US. I don’t know of any other $500 investment one can make that has this much positive sonic impact on what our ears perceive at the listening positon. I view “accurate sound reproduction” as the music arriving at my ears matches as close as possible to the content on the recording. Technically, we are matching waveforms with a high degree of accuracy and precision, while taking into consideration real world transfer function limitations.
Just like a good quality DAC or amp, the frequency response is flat (tilted for psychoacoustic perception for loudspeakers in rooms), with flat group delay and phase response, save the minimum phase response of the loudspeaker that does not reproduce down to DC. Perfect step response where first arrival frequencies arrive at ones ears, all at the same time. Again, slightly different in the acoustic domain to take into account the loudspeakers low frequency roll off. We can accurately and precisely match the digital test signal all the way through the system to ones ears as demonstrated by the measurements of my fugly cinema loudspeakers.
Note one can route the test signal through JRiver’s digital input and 64 bit convolution engine, DAC, analog output, preamp, amp(s), loudspeakers, room, and to ones ears. That means that Audiolense is correcting the entire playback chain, digital, analog, electroacoustic, and acoustic. So any anomalies or channel imbalances or other potentials for frequency and/or time domain distortions, are taken care of, all the way to ones ears. Something to ponder as Audiolense’s filters are very powerful with 65,536 filter taps. This is 2000 times more powerful than MQA’s 32 filter taps and most DAC’s few hundred filter taps, albeit for different filtering purposes.
This is all a bit technical and does take some effort to get it right, but the payoff is unlike most people have heard. That’s the issue. Most folks don’t have a baseline to compare to. Hence measurements, to verify smooth frequency response, flat phase and group delay, removal of low frequency room reflections, and time aligned sound arriving at your ears, in your environment. If one can replicate the measurements I have here, which is certainly doable, even on an industrial loudspeaker designed to be in a cinema like mine, you will be rewarded with accurate sound reproduction. Once you hear it, there is no turning back.
Look for an updated version of my eBook with additional fine tuning techniques in addition to more detail about the basics, such as multi-seat correction and using more of the measurement and analysis features. In the meantime, don’t forget to check out Bernt’s PDF help file attached at the end of this article. There is an Audiolense User Group to search and ask questions.
In the end, it is the linear phase target that I enjoy the most and my preference.
I hope folks give the demo a try and hear for yourself the improvements one can make to restore the response to what’s on the recording arriving at your ears with very little frequency or time distortion.
Update
It’s been two weeks since I wrote this article and thought to provide an update. I have not made any further changes since where I left off. Still the same flat to 1 kHz and straight line to -6 or -7 dB at 20 kHz linear phase target. Still the same TTD (5&2 cycles) and partial correction parameters (20 kHz freq, 5 kHz TTD). I have listened to a wide variety of source material for hours each day. Very happy with the result. I don’t think I can make it sound any better. Or can I…?
I like the sound of 15” high efficiency woofers in big cabinets because they sound… big! I like the feeling of being at a rock concert in my home with this type of big sound. The 4722’s pound the rock and blues that sooths my soul. The 4722’s kicks and punches, but rolls off a bit early in the bottom octave, even for rock and blues music. Most rock, blues, and certainly distorted alt, typically do not have much content below the low E on a regular 4 string bass guitar (i.e. 41 Hz). And is dependent on how much the drums have been rolled off in the bottom octave during the recording/mix/master process.
So a pair of music subwoofers are on the way to add a bit of weight from 20 to 40 Hz. Stay tuned for another article dialing in a pair of subs.
Enjoy the music!
Audiolense Help Document (PDF 3.2 MB)
Note: Mitch Barnett's article titled " Integrating Subwoofers with Stereo Mains using Audiolense" can be found via the link below.
Mitch “Mitchco” Barnett.
 I love music and audio. I grew up with music around me, as my mom was a piano player (swing) and my dad was an audiophile (jazz). My hobby is building speakers, amps, preamps, etc., and I still DIY today.
I mixed live sound for a variety of bands, which led to an opportunity to work full-time in a 24-track recording studio. Over 10 years, I recorded, mixed, and sometimes produced over 30 albums, plus numerous audio for video post productions in several recording studios in Western Canada.
 I wrote this book to provide the audio enthusiast with an easy-to-follow step-by-step guide for designing a custom digital filter that corrects the frequency and timing response of your loudspeakers in your listening environment, so that the music arriving at your ears matches as closely as possible to the content on the recording. Accurate Sound Reproduction using DSP. Click on Look Inside to review the table of contents and read the first few chapters for free.


Recommended Comments
Create an account or sign in to comment
You need to be a member in order to leave a comment
Create an account
Sign up for a new account in our community. It's easy!
Register a new accountSign in
Already have an account? Sign in here.
Sign In Now