

 In this article, I walk through the steps using Acourate to produce a default or baseline correction that is repeatable. By following the same steps, one should be able to achieve a similar baseline correction. This baseline correction is designed to provide the listener with a perceptually flat frequency response from 20 Hz to 20 kHz. Making the measurement and correction process predictable and repeatable is important to achieving a successful sonic result that one would be happy with.
Dr. Uli Brueggemann’s Acourate ( approx. $400 USD) is a high end audio toolbox with many functions. The Acourate web site provides a good description of the software solution:
“The sound arriving at the listening position is measured and analyzed. The quality of the direct sound is analyzed preferentially within an adjustable time window. In combination with a target function (adjustable by the user according to listening habits and preferences) a correction filter is calculated. The music signal will be corrected by the filter during playback. Thus an optimized sound will arrive at the listening position.
Low frequencies cause standing waves in any room, also described as room modes. Some frequencies will be boosted, others will be attenuated. The room correction avoids too loud playback levels by attenuating the corresponding frequency range. Weak levels will be boosted carefully to a higher level.
Acourate applies a psychoacoustic analysis to ensure correction filters fitting to the human ears.
Furthermore Acourate corrects timing errors of the room and the speakers by a phase correction. The target is to get as close as possible to an ideal step response, the best possible coherence, and similarity of response between the loudspeakers.
As a result the music reproduction is improved regarding tonality, sound stage, focusing, transparency, clarity, resolution and attention to detail.”
Mastering engineers, Bob Katz and Dominique Bassal provide testimonials for Acourate. Here is an excerpt from Bob Katz:
“Acourate is the first DRC that I can thoroughly recommend. The resulting sound is unquestionably equal or superior to the uncorrected loudspeaker in all respects: Transparency is equal, there is no perceived loss with Acourate. It is truly an audiophile-quality system that even die-hard audiophiles and analogphiles need not be afraid of. Everything else about Acourate makes the corrected loudspeaker sound superior: Stereo imaging and soundstage are more exact and the sweet spot in the center is effectively widened. Tonality is greatly improved and the frequency response extends perceptually flat from 20 to 20 kHz. Transient impact is superior and there is no loss of headroom and no perceived noise, when the gain staging is done correctly. Some of the technical reasons for Acourate's superiority: 64-bit calculation throughout, properly dithered to 24-bits at the end of the chain; no degrading ASRC circuit, the sample rate that goes out is the same as what comes in. No overcorrection, a unique breakthrough in psychoacoustic analysis beats any previous third- or sixth- octave techniques for estimation of the audible effect of the room and loudspeaker combination, and a variable calculation window ensures accurate frequency response. For the first time with any correction system, I felt no need to change or tweak any filters or add any filters to the circuit. Superior target design, this is the most ergonomic part of the program and allowed me to zero in on the ideal high frequency rolloff for my system in a very short time. I haven't found need to change the target since the first day I designed it. Superior impulse response and phase response. Superior crossover implementation, linear phase and with the most accurate curve. Basically, they do everything right and I've only scratched the surface in this description of its superior abilities. Superior to any other DRC I have used or tested.”
I have been using Acourate for several weeks and can verify that it works as described in Uli’s solution description. I also agree with Bob Katz and Dominique Bassal testimonials. To my ears, Acourate’s psychoacoustic designed FIR filter is absolutely transparent. Just as transparent as my Lynx Hilo. The Acourate designed filter sounds perceptually correct to my ears. Meaning that the tonal balance is neutral with a solid 3D image. I will say more in the conclusion. Let’s get started with the walkthrough.
Hardware requirements:
A calibrated measurement microphone, microphone preamplifier, mic stand, cables, and an Analog to Digital Converter (ADC) are required. I use MP-1r-KIT Acoustical measurement kit (approx. $230 USD). The kit comes with a calibrated mic and preamp:

The kit is spec’d from 20 Hz to 20 kHz ±0.2 dB. Wolfgang, the owner of iSEMCon, has indicated to me that the mic has useable response to 30 kHz. Wolfgang also offers measurement mics with calibrated responses past 30 kHz as does other manufactures, like the Earthworks M50 (3 Hz to 50 kHz ±1/-3 dB). Coupled with a Rane MS1S Mic Stage (flat from 3 Hz to 100 kHz), one could have accurate and precision measurement of infrasonic and ultrasonic responses. Another approach is to purchase a calibrated mic from a company like Cross Spectrum Labs or order one from Uli. These are but a few suggestions.
A calibrated mic is required to tailor the system’s frequency and phase response to a specific “target” response with a tight tolerance. This level of precision is critical to achieve accurate tonal balance (i.e. perceptually flat from 20 Hz to 20 kHz). Being off by 1 dB or so is not only audible, but can tilt the overall tonal balance (i.e. timbre) from being a bit too dull to a bit too bright or vice versa. More on target response later.
Side note, Acourate requires using a sound card or outboard A/D D/A converter with an ASIO driver. ASIO bypasses the normal audio path from a user application through layers of intermediary Windows operating system software so that an application connects directly to the sound card hardware. ASIO provide the lowest latency interface, and avoids common issues of the Windows OS resampling and/or applying DSP effects unbeknownst to the operator.
Set up to take measurements:
The measurement microphone is set up in the listening position. I have been using DRC software for 2 ½ years and measuring speaker systems/acoustic spaces spanning 30 years. Including studio control rooms, audio dealer critical listening rooms, live sound venues, iMAX theaters, etc. My point being is that there are many ways to take acoustic measurements. Based on my experience, I have tried to make this as simple as possible, yet cover off the most important aspects:
- Establish a Reflection Free Zone (RFZ) in the listening area as best as possible. For acoustic measurements, move any chairs, tables, sofas, etc. out of the way between the speakers and the listening position. The Calibrated Acoustic String is a great method for determining a RFZ. More on RFZ and acoustic treatments. From a technical measurement perspective, the rule of thumb is, with an ETC window from 0 to 50 milliseconds, all reflections (amplitude spikes) are -20 dB or lower from the peak. My room meets this spec.
- Set the height of the measurement mic to be the same height as ones ears (while sitting in the listening position) and ideally that would be the same height as the speaker’s tweeters.
- If measuring a stereo system, point the microphone towards the speakers, down the centerline. If measuring a surround system, point the measurement mic straight up. Whichever position is chosen, be sure to use the corresponding calibration file. There should be a calibration file for on axis response and one for 90 degree diffuse response.
- Whether using a tape measure or laser distant measurer, it pays sonic dividends to line everything up to be as symmetrical in the room as possible and to as tight of a tolerance one can achieve. Hint: a 20 kHz frequency has a wavelength of 0.678 inches. I recommend marking the mic position once set up so it is easy to place the mic in the same spot the next time around.
Almost ready to measure, but the first step is to import the microphone calibration file into Acourate.
As an aside, Uli offers a free service where one can download a standalone version of AcourateLSR2 Logsweep Recorder, take a measurement, send the resultant pulse files to Uli, along with a couple of songs. Uli then prepares the correction and convolves the music with the correction and sends the convolved songs back in which one can listen and compare to the original tracks.
Import the microphone calibration file:
A directory structure is required to store Acourate projects. I created a directory structure called, “AcourateProjects” at the root of my C drive, and in this folder, created a number of subfolders to hold various Acourate projects. I also copied my microphone calibration file into the subfolder I am using for this article. Note that the mic calibration file may have a “.cal” file extension. To make it easy to import into Acourate, change the file extension to “.txt”.
Once the folder structure is created, the next step is to launch Acourate:
Click to enlarge
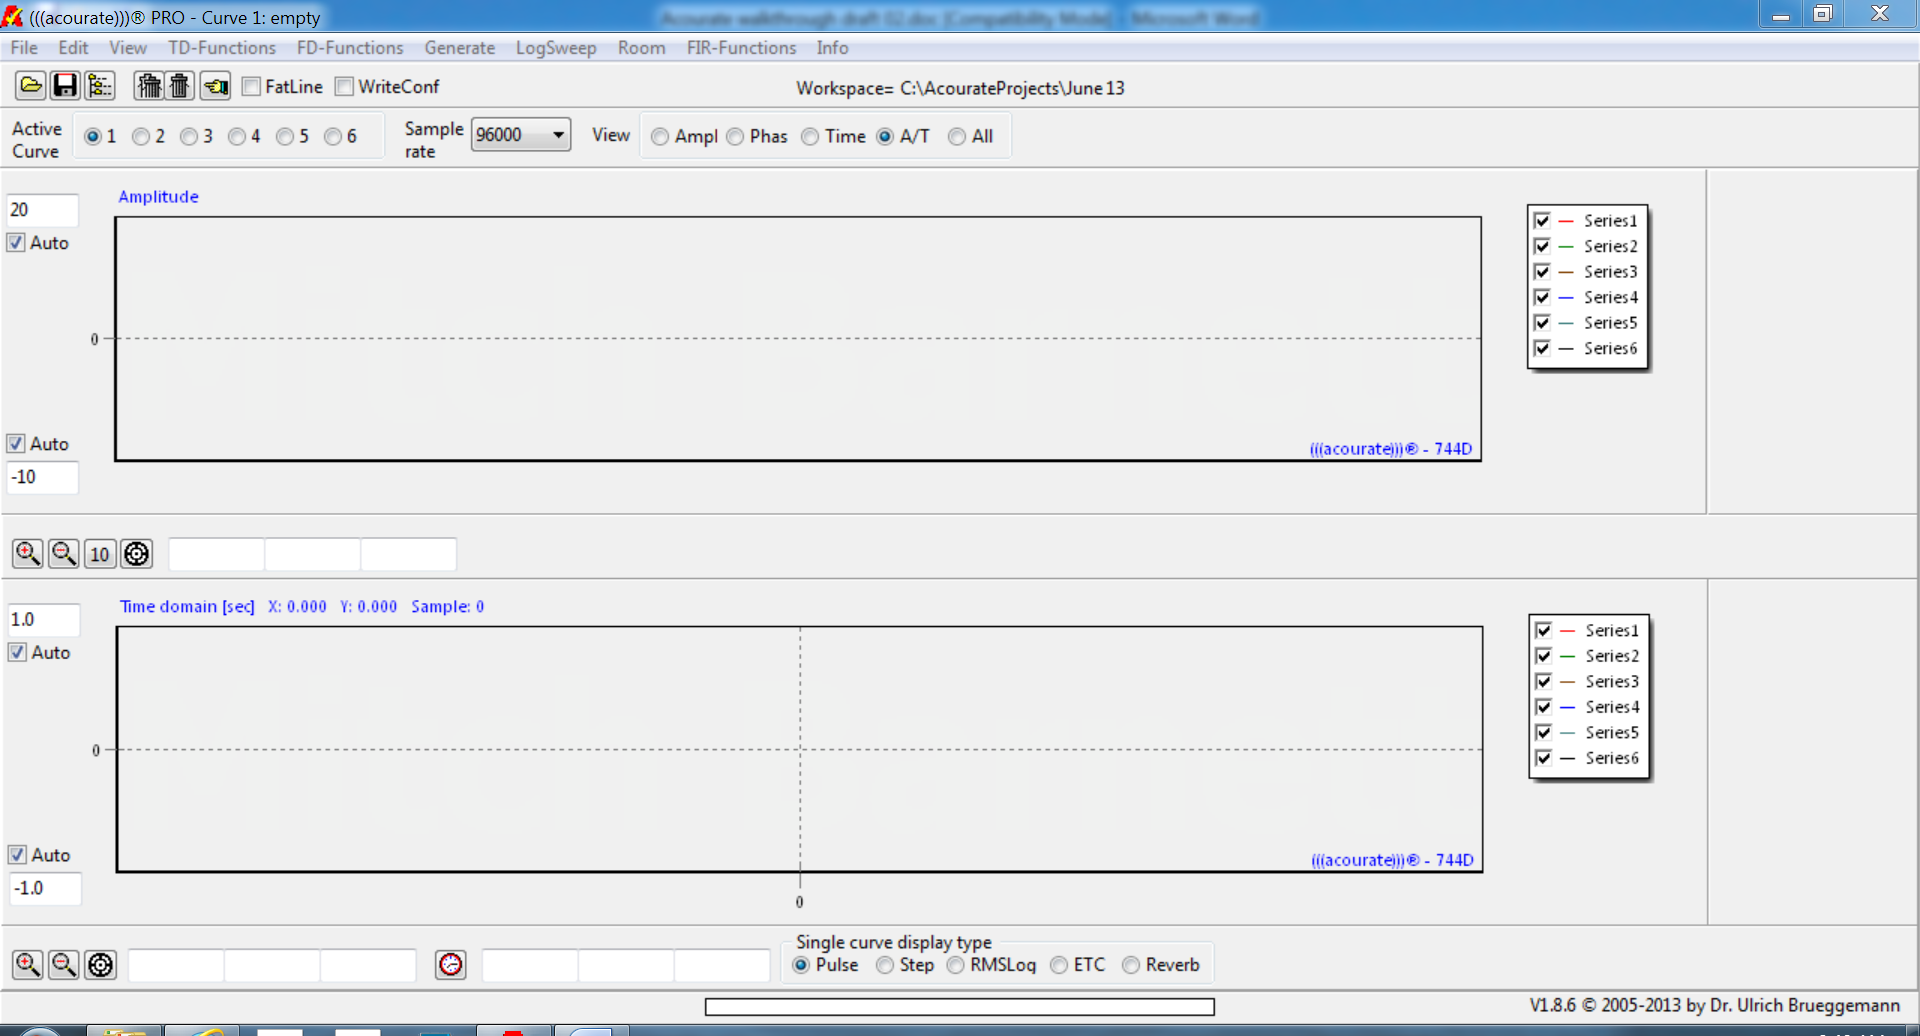
In the Sample rate drop down box, select the sample rate for the project. If interested in ultrasonic response, 48, 88, or 96 kHz would be good choices. I selected 96 kHz.
The next step is to set the project workspace to one of the subfolders previously created. Under the File menu, select, “Project Workspace Definition”. This will bring up the following dialog:

Here I clicked into the directory path field which opens a file navigation dialog, and navigated to one of the subfolders I created under AcourateProjects directory.
Now that I have an active workspace, from the File menu, select: “Import Amplitude (Mic Calibration or Target Curve)” which opens up a file dialog to the just set workspace path and now import the mic cal file. A dialog box will appear:

Click on yes. Another file dialog appears:

Click on yes.
Acourate should now display the mic calibration:
Click to enlarge
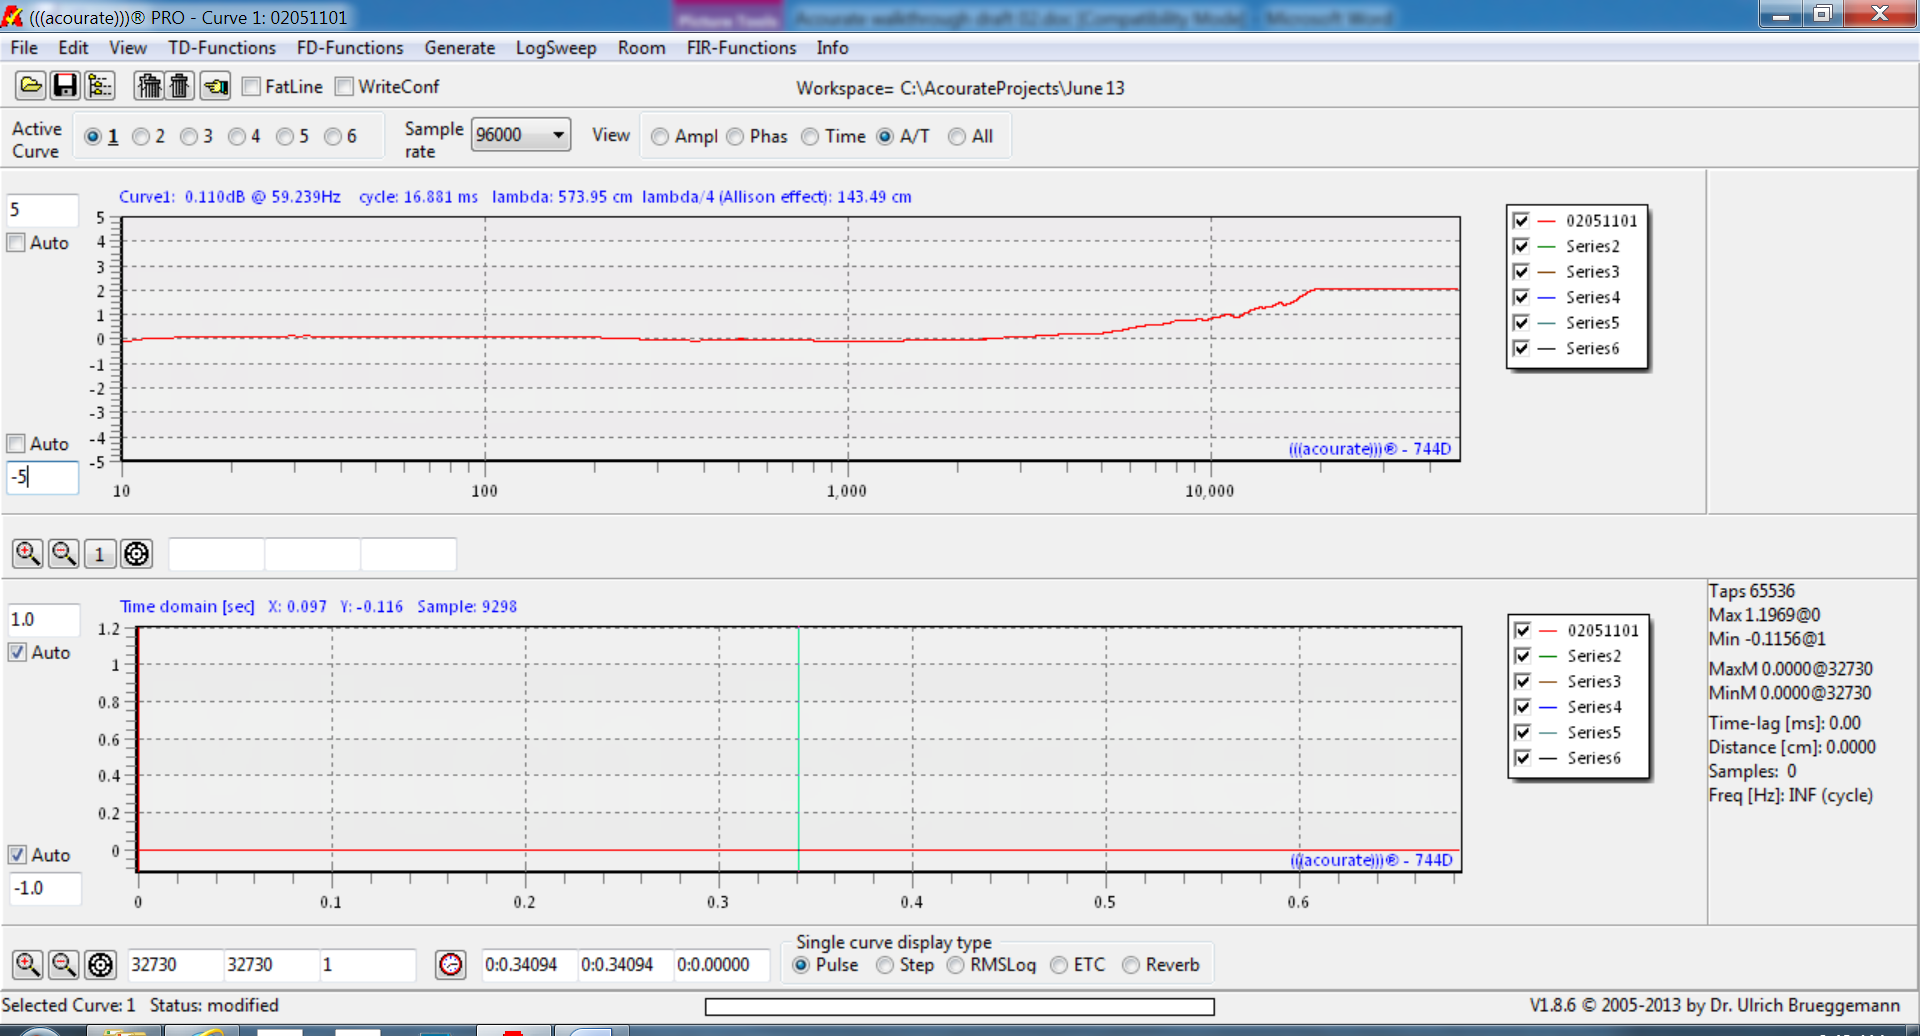
To get a better view of the amplitude response, in the toolbar, click the radio button Ampl:
Click to enlarge
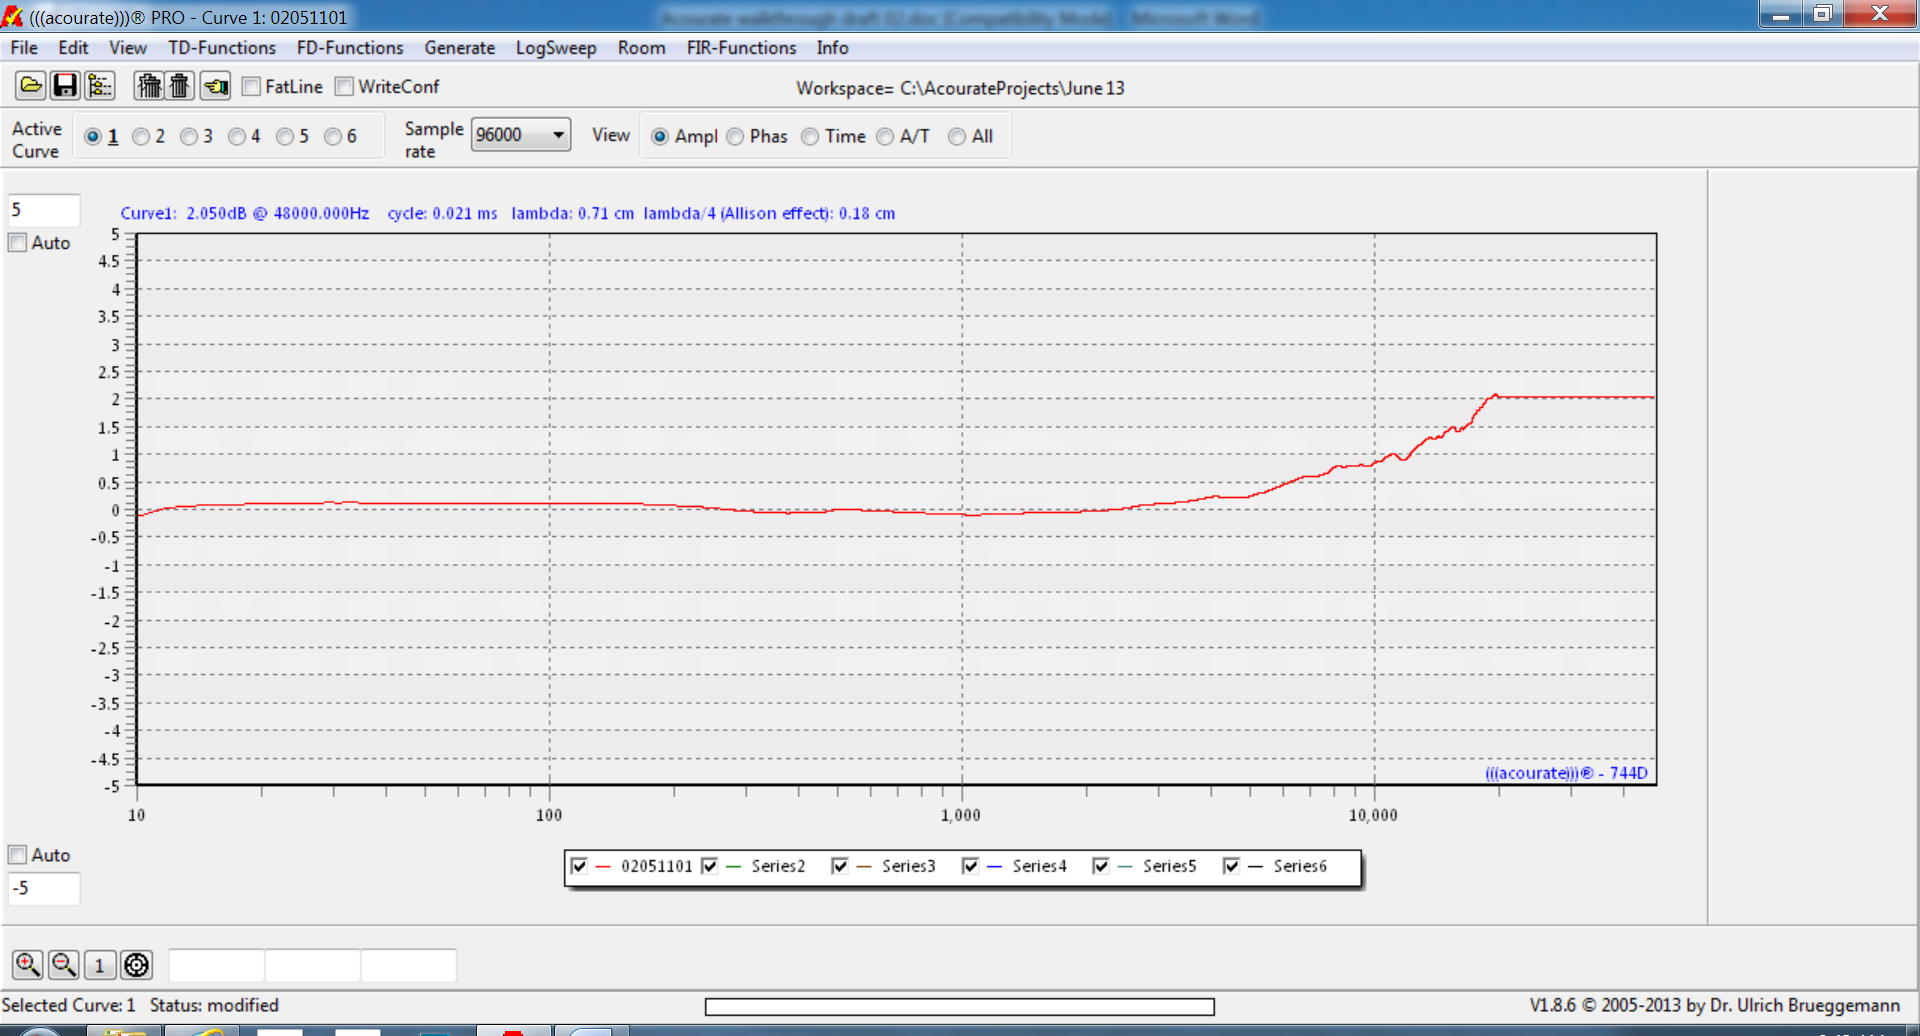
This is displaying the amplitude over frequency of the microphone calibration file. Remember, we don’t want the frequency response of the microphone to influence the measured response of the speakers and room.
Under the menu FD-Functions, select, “Amplitude Inversion”. A dialog box will appear:
Click to enlarge

Leave Minimum Phase selected. Click the Series2 radio button as that is where the result (inverse) curve will be placed once calculated.
As a side note, notice in the toolbar the Active Curve 6 radio buttons. Whenever saving or opening files, click the appropriate Active Curve button first for the file to be saved or an empty radio button when opening a file. For example, when first launching Acourate, the 1st button will be selected, so when opening a pulse response, like for the left speaker/room measurement, it will be in active curve 1. When opening the right pulse, ensure that the active curve 2 radio button is selected first, otherwise active curve 1 will be overwritten, in the display, but not the saved file on disk.
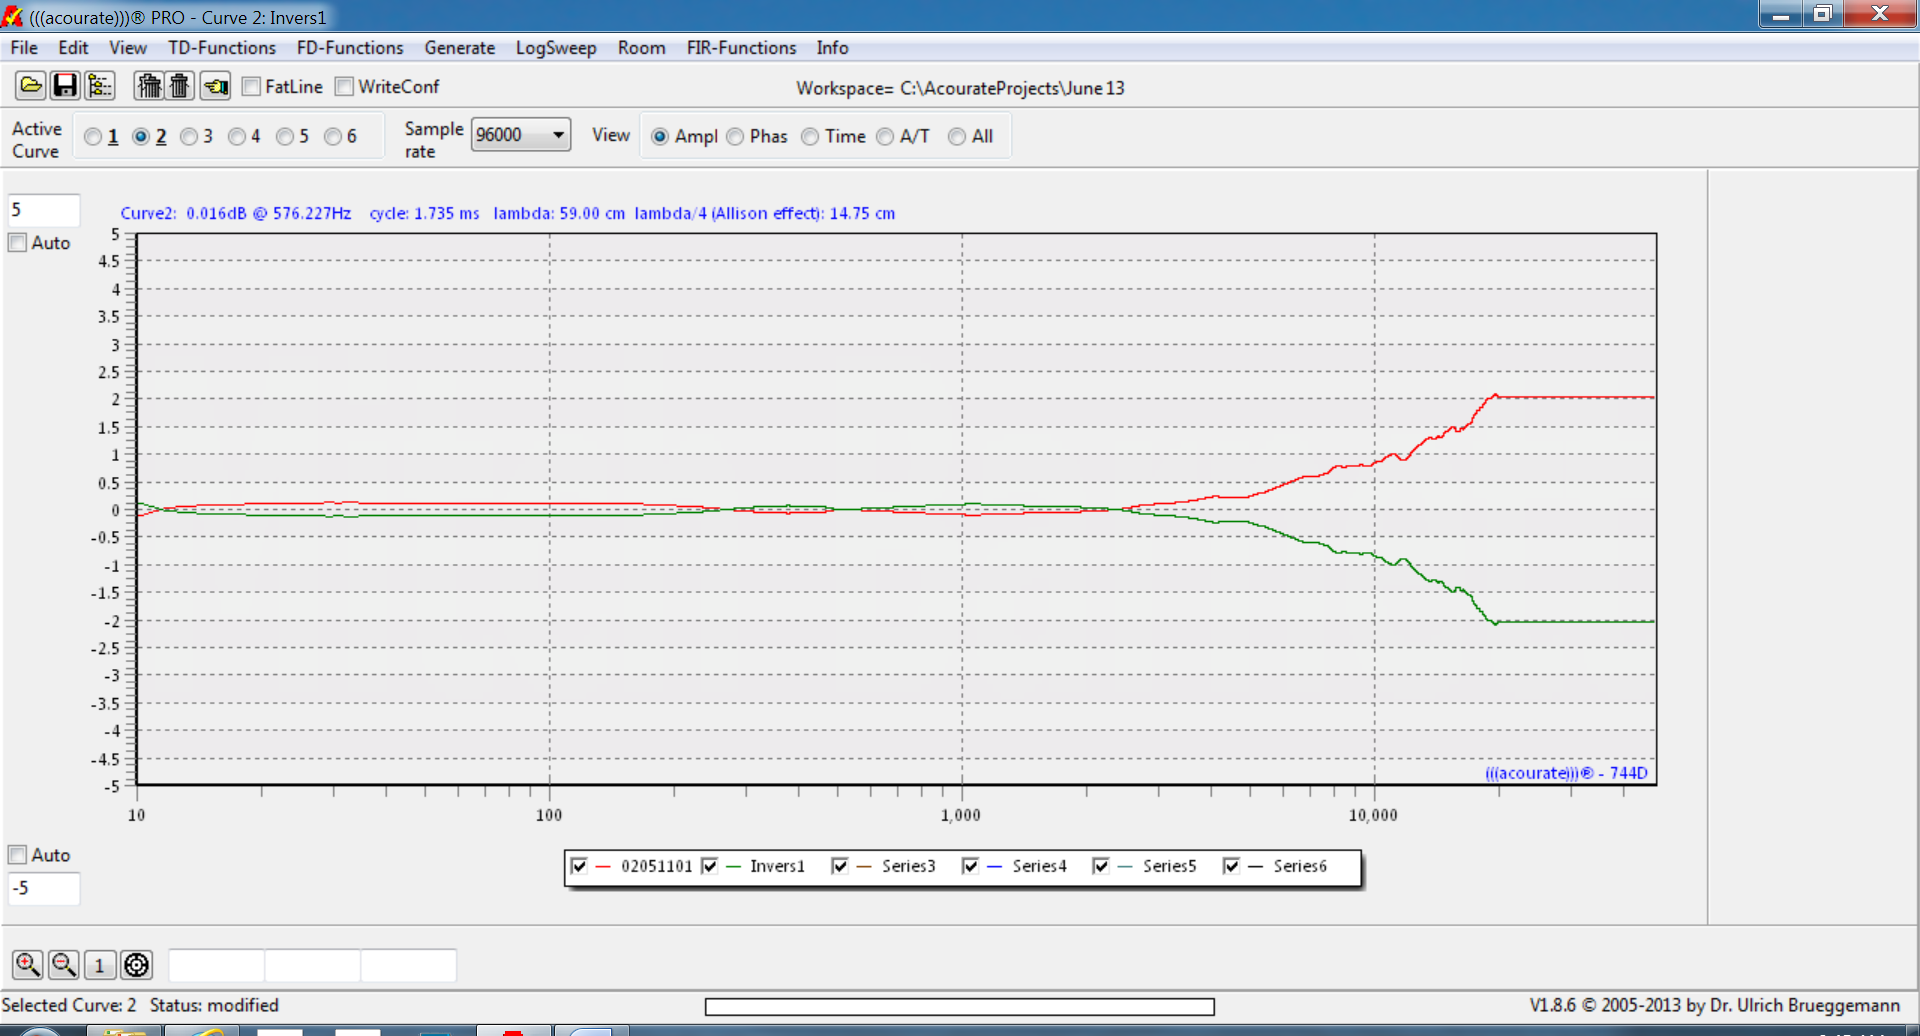
Click on Calculate Inversion. Acourate now should be showing the mic cal and the inverse of the mic cal, similar to this:
Click to enlarge
Under the File menu, select, “Save Mono Wav” which opens a File Save dialog box. I named mine: “mic cal.wav”. A Save Option dialog will appear:

I chose 64 bit.
Once the dialog closes, under the Edit menu, click on “Clear Curve”. Now that the mic cal is cleared from the main Ampl window, on the toolbar, click on the radio button: “A/T” which now shows both the amplitude and time graph displays.
From the LogSweep menu, select: “LogSweep Recorder”:
Click to enlarge
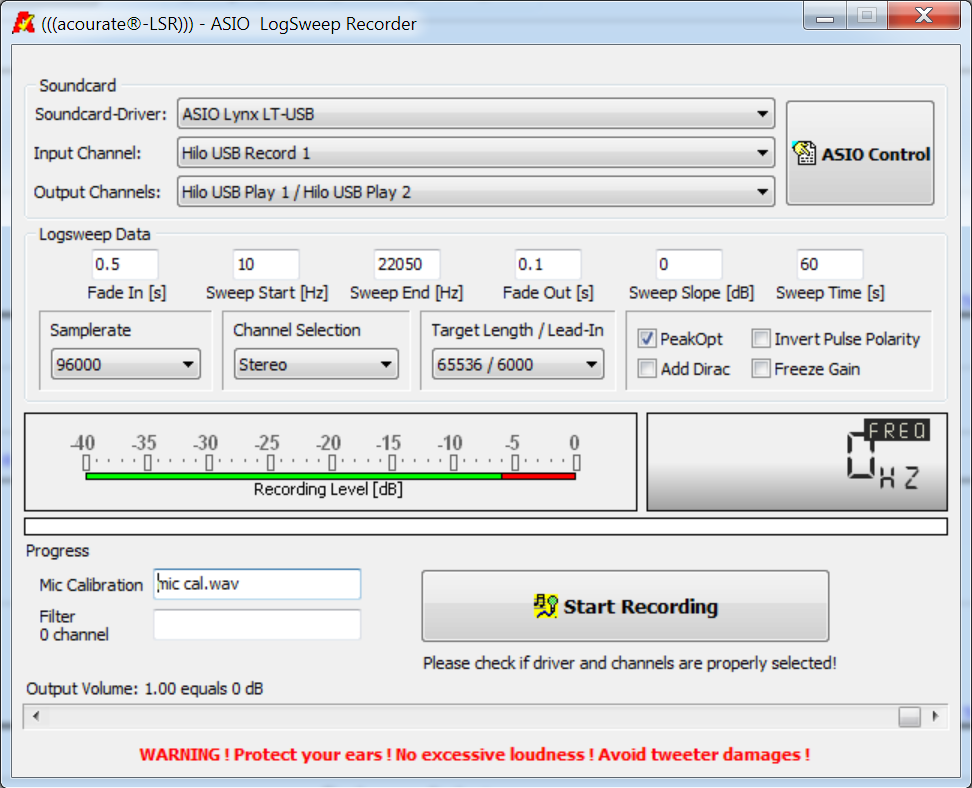
If using the free LogSweep Recorder (LSR2) to try Uli’s free service, it will look like this:
Click to enlarge
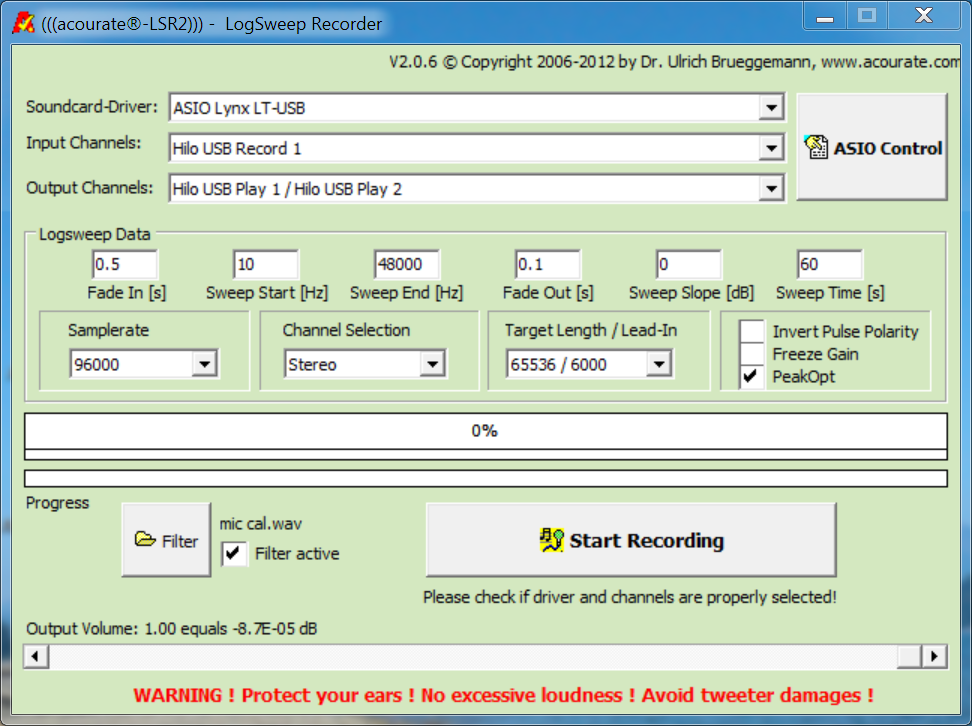
In the LSR2 above, click on Filter and select the mic cal. In the Acourate version of the LogSweep Recorder, click into the mic calibration field and an open file dialog box will appear. Select the mic cal file. All done. Keep the LogSweep Recorder open.
Taking the first measurement:
With the LogSweep Recorder still open, I adjusted a few parameters. I know my floor standing speakers have a frequency range of about 30 Hz to 30 kHz. In the “sweep start” field, I left the default value of 10 Hz. In the “sweep end” field, I entered 33 kHz. If the project sampling rate is 48 kHz, then the maximum sweep end is 24 kHz. With 96 kHz project sample rate, the maximum sweep end is 48 kHz. If required, select sound card driver and input/output channels:
Click to enlarge

Note the warning in red. If one has a SPL meter, each speaker should be outputting 83 dB SPL (slow averaging, C weighting). If no meter, the monitor level (i.e. volume) should be set so that the speakers are playing at a comfortable listening level. Note the sweep takes 60 seconds, so if it is too loud, that affords an opportunity to turn the monitor level down.
Click Start Recording:
Click to enlarge
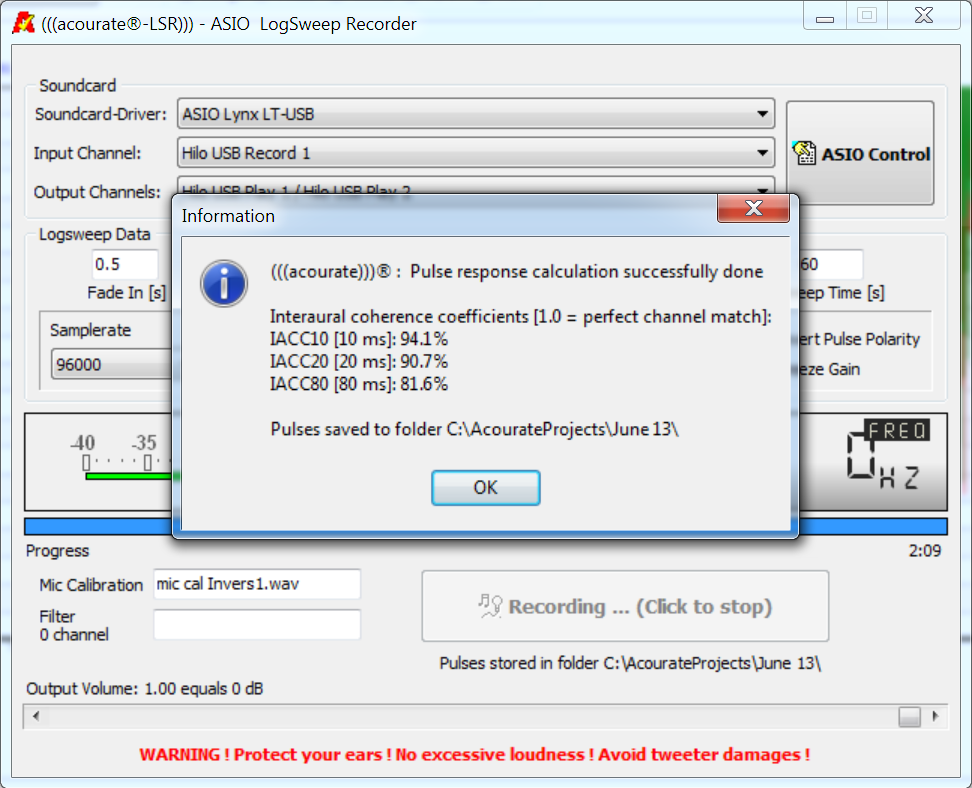
Recording complete.
Click to enlarge
Calculating the filters:
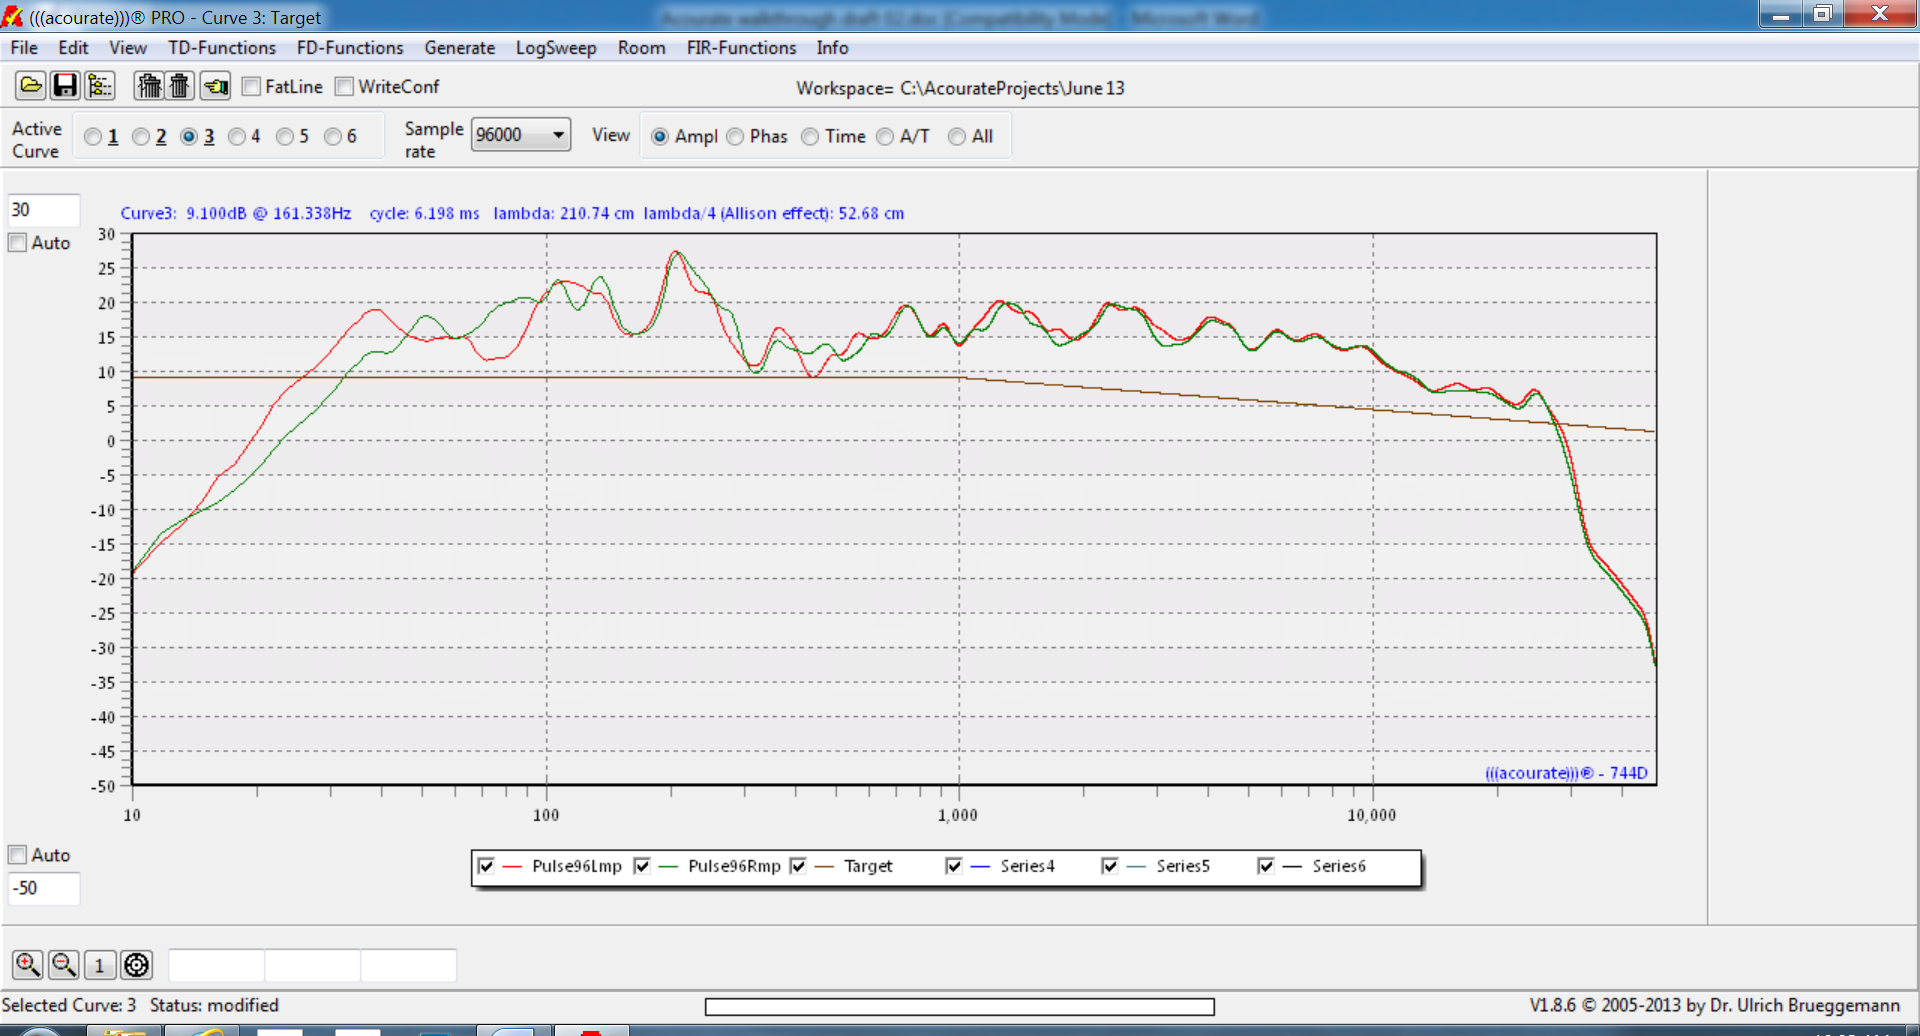
Let’s have a look at the amplitude over frequency response of the system. In Acourate toolbar, select the radio button Ampl:
Click to enlarge
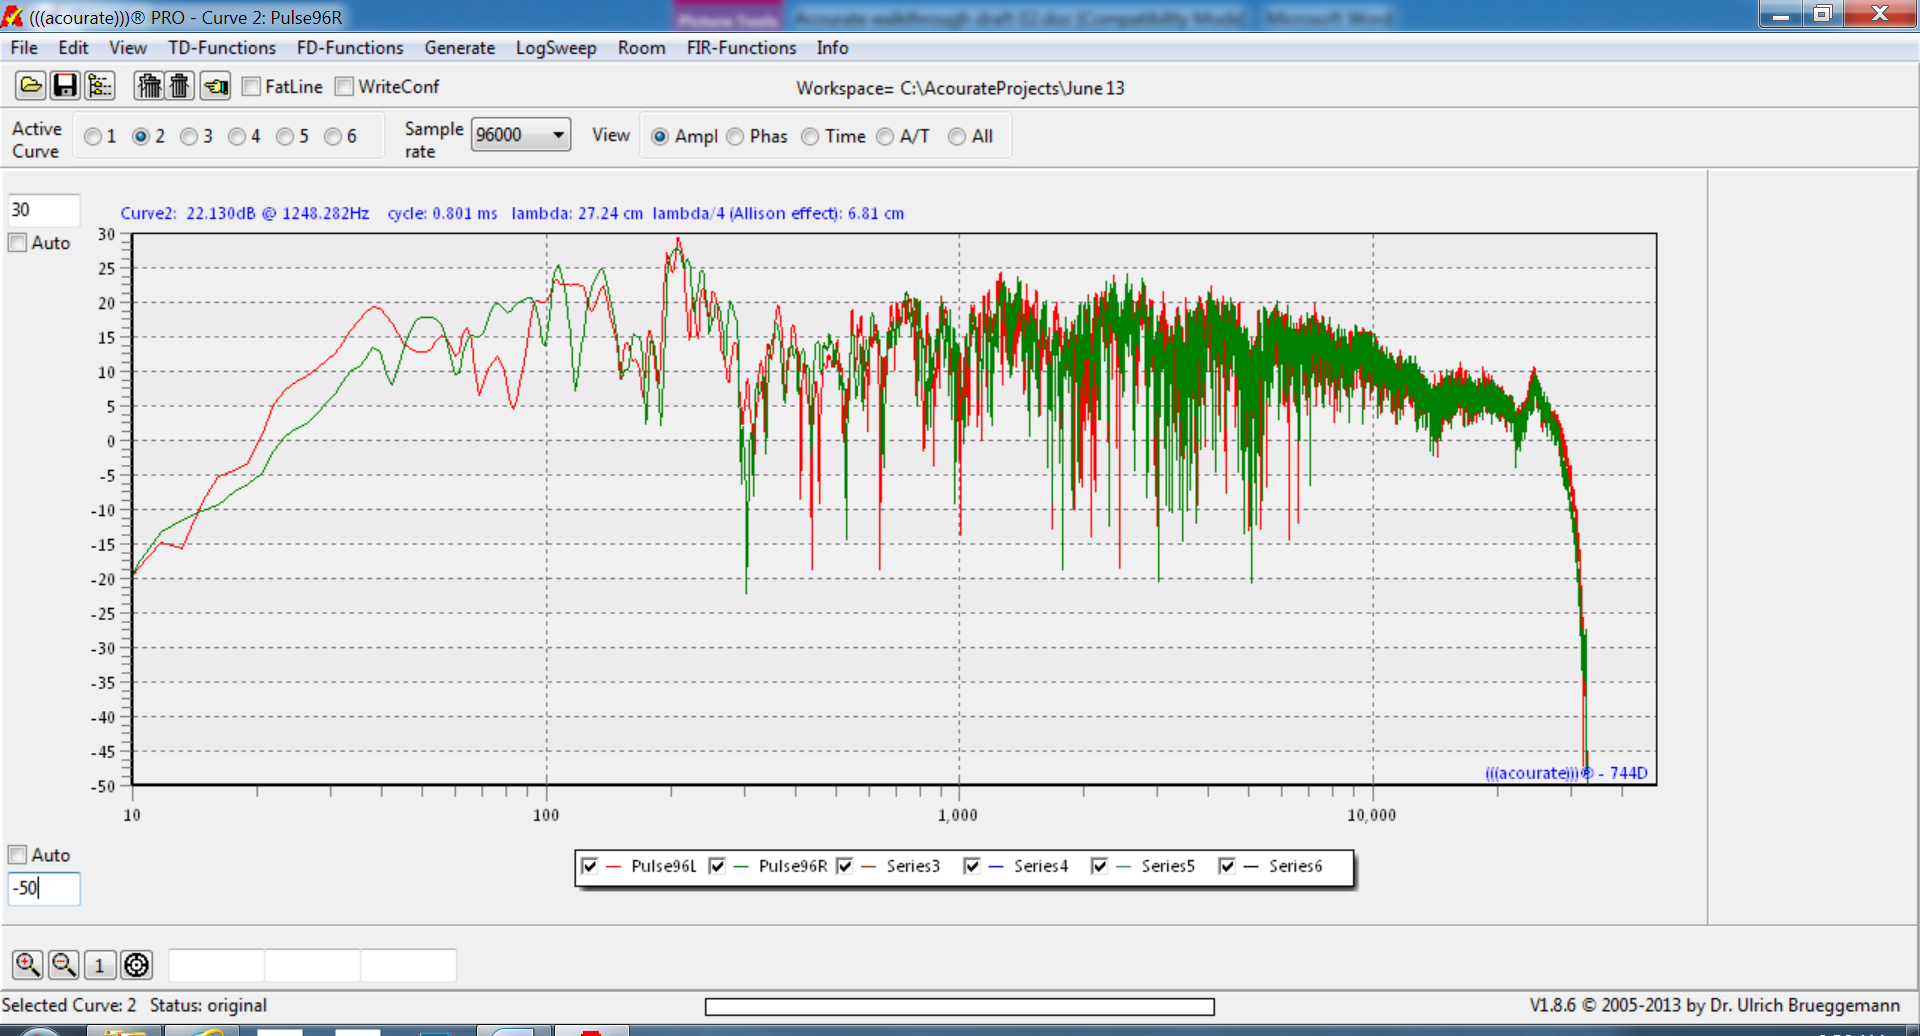
On the left hand side, above and below the auto checkboxes, I enter in values (30, -50) to show more of the amplitude. This is a full resolution (i.e. unsmoothed) view of the frequency response of the system.
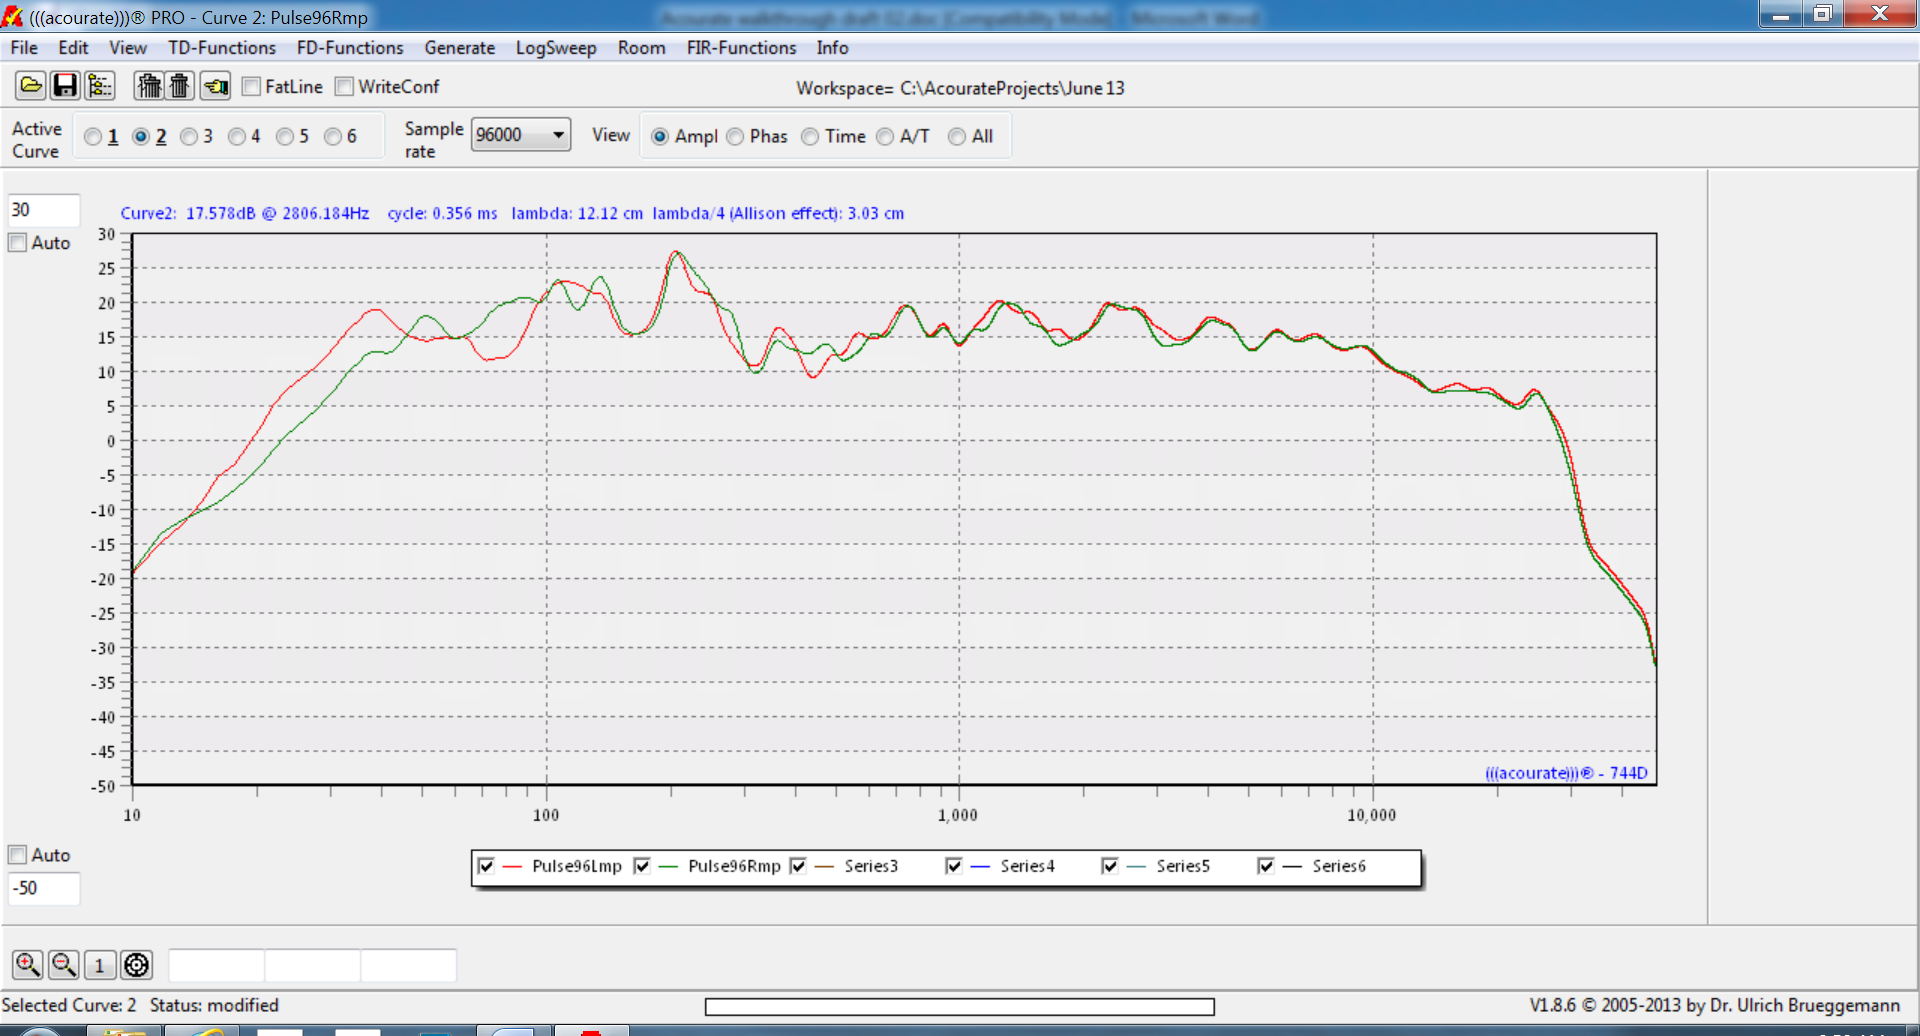
In order to “see” how our ears “hear”, Acourate calculates a psychoacoustic frequency response which also takes into account the transient behavior of music signals. In Acourate, under Room, select Room Macro 1 Amplitude Preparation:

I am not going to explain each field in every screen shot. Uli provides answers to those in this introduction to Acourate (PDF Link). However, I will mention which fields I have changed from default values. Best practice is to enter a “High Frequency Treatment” value that is 1 kHz or so less than the “sweep end” value used in the measurement. This prevents any issues due to the sharp cutoff. The psychoacoustic treatment applies a gentle filter to prevent discontinuities. Otherwise I left the defaults. Acourate now displays a visual representation of how I perceive the spectral response of my speakers/room at the listening position:
Click to enlarge
Now I can apply a target curve. In Acourate, under the Room menu, select Macro 2 -Target Room Designer:
Click to enlarge
This is like starting out with a blank canvas as one can design any target curve, within reason. The purpose of the target curve is to design the in-room tonal response. One is playing with tonality and every dB counts. I could start out with a straight line target that is “flat”. However, a flat in-room frequency response is not the desired target.
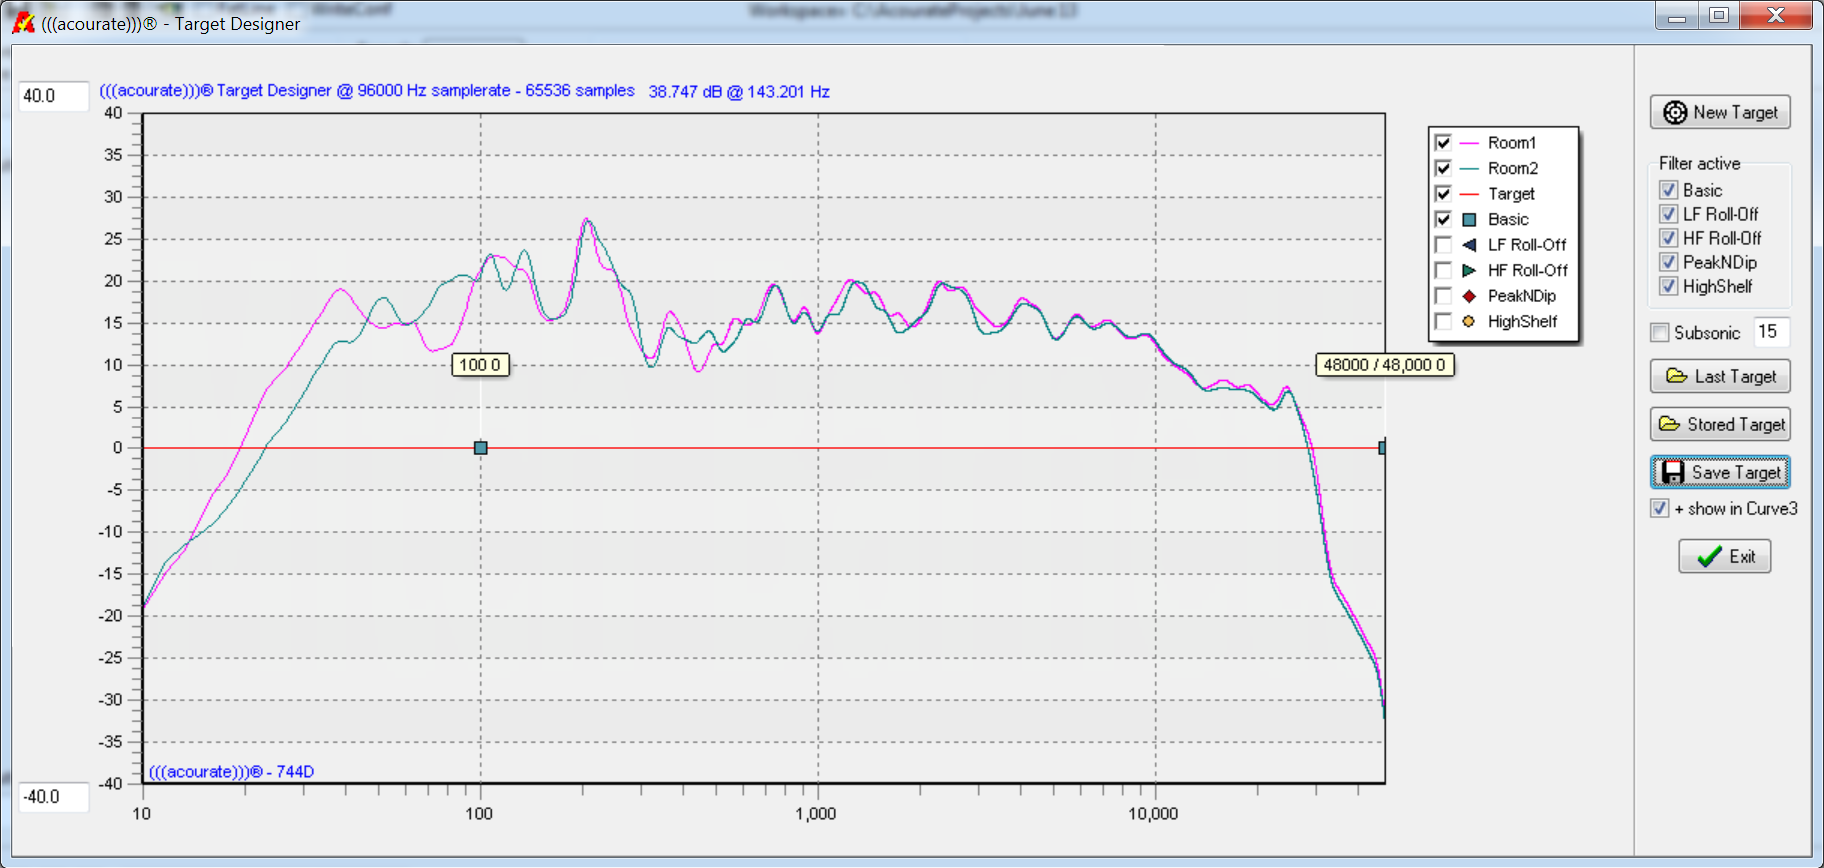
I have found that the following target provides a “perceptually” flat frequency response (thanks to Bob Katz):
Click to enlarge

Note I have zoomed in on the amplitude scale so each vertical division is 2 dB. Some folks may be surprised at the frequency response unevenness, especially below 400 Hz. This is typical for most speakers in real rooms, even in (moderately) acoustically treated rooms, like mine for example. More on this in the conclusion.
The design of the target specification is flat to 1 kHz, and using 1 kHz as the hinge point, a straight line to -6 dB at 20 kHz. Target design requires accuracy with precision. Even a 0.1 dB change in tilt at 20 kHz makes a meaningful audible difference because the target is a broadband adjustment from 1 kHz on up. Each one of the green dots on the target designer is an anchor point that can be clicked on and moved around. Target points can be added by grabbing the point on the far right and dragging it on the target. Also note, a variety of filters on the right can be engaged. Take care that the target is below the measurement. Only parts of the measurement curve above the target will be corrected. Save the target and exit.
Click to enlarge
With the perceptually flat target designed, the next step is to apply inversion (i.e. target curve – measurement = correction). From the Room menu, select Room Macro 3 Inversion:
Click to enlarge
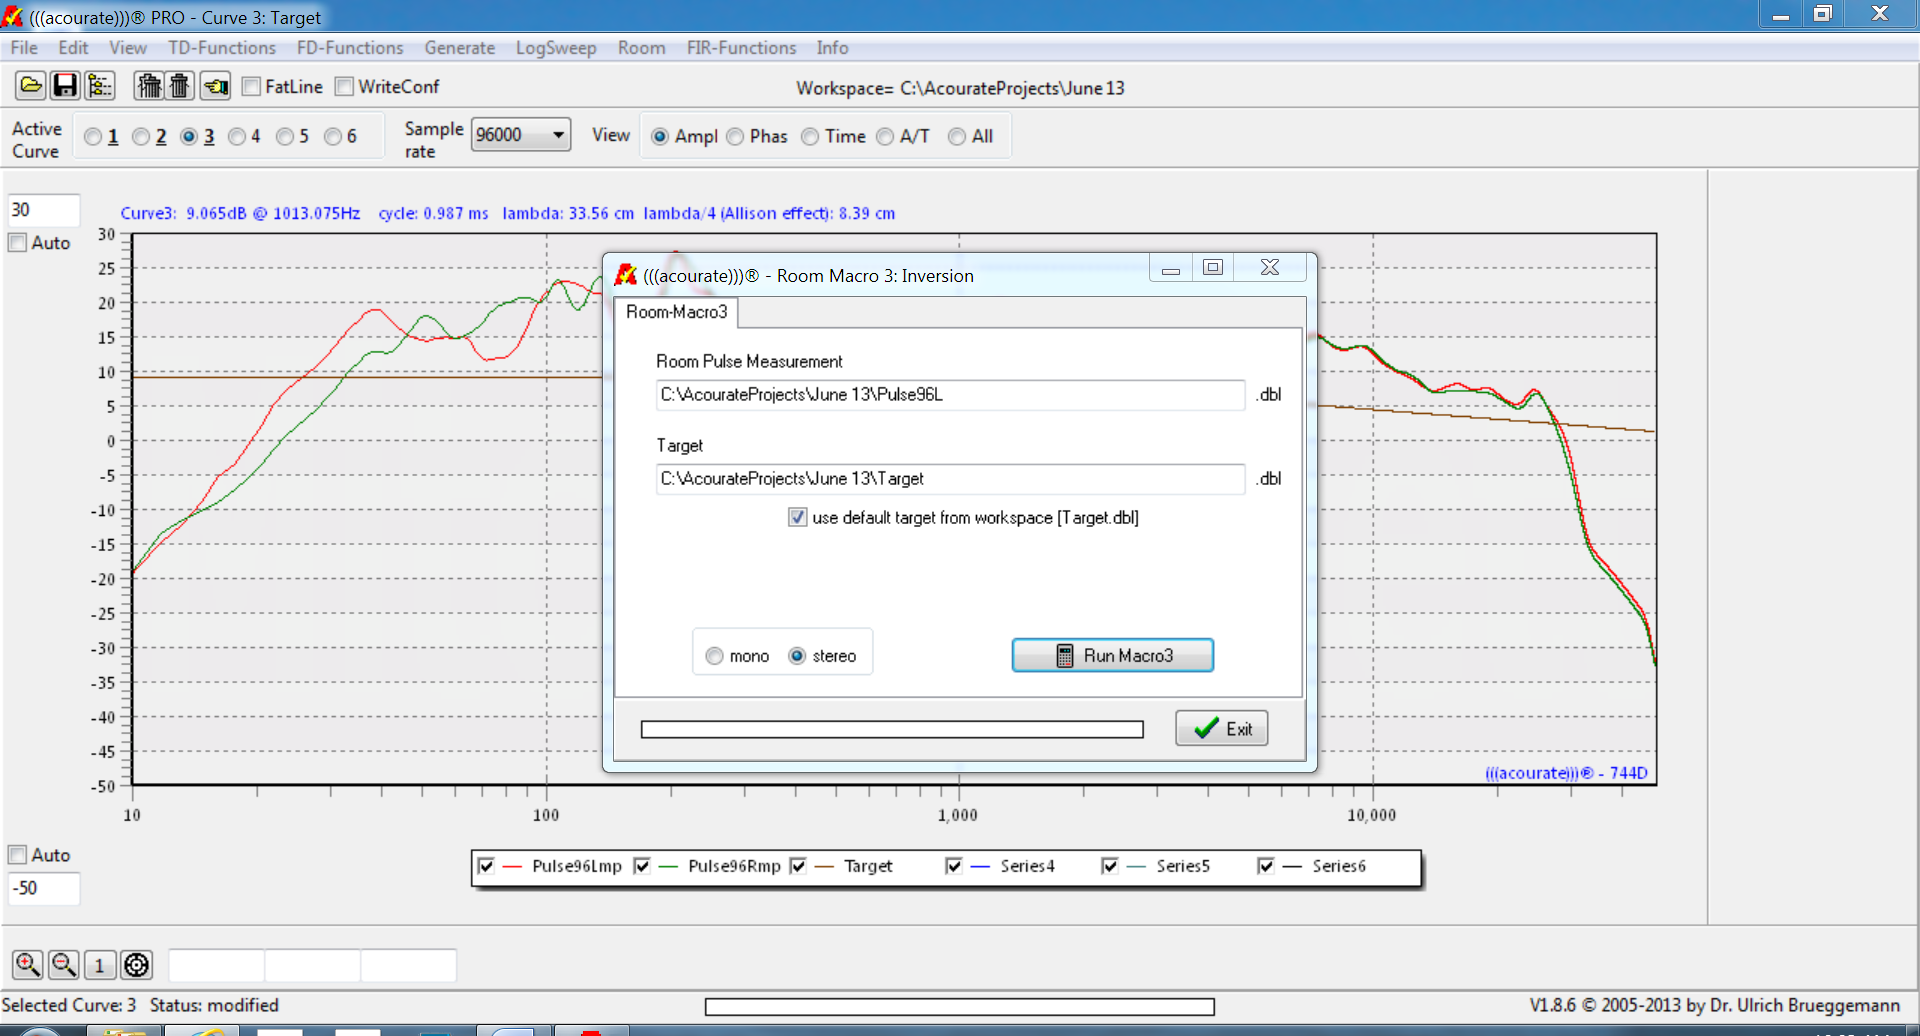
Run Macro 3:
Click to enlarge

From the Room menu, select Macro 4 – Filter Generation and excessive phase correction:
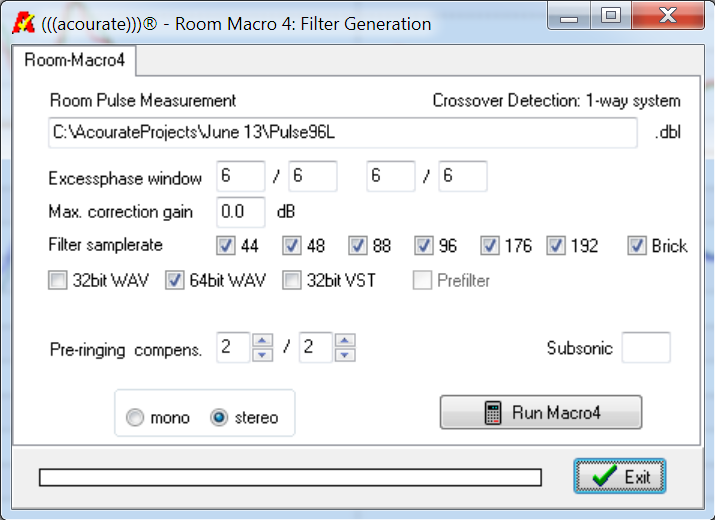
Similar to the frequency dependent windowing in the amplitude preparation, frequency dependent windowing parameters have to be defined for the excess phase correction. The windows define the time span for phase calculation. Start values are 1.5/3. For left and right channels one can define different values, but they should not be too different. A bigger value will result in a bigger phase correction. But it is necessary to watch out for instable results with big values. In my case, I entered in values 6/6 for left channel and same for right channel.
Note that there is no correction gain being applied. By default the correction will be normalized in a way that no frequency will be boosted above 0 dB.
Check all filter sample rates that will be used. Finally, set pre-ringing compensation, in my case, I set 2/2. More about pre-ringing compensation.
Run Macro 4:
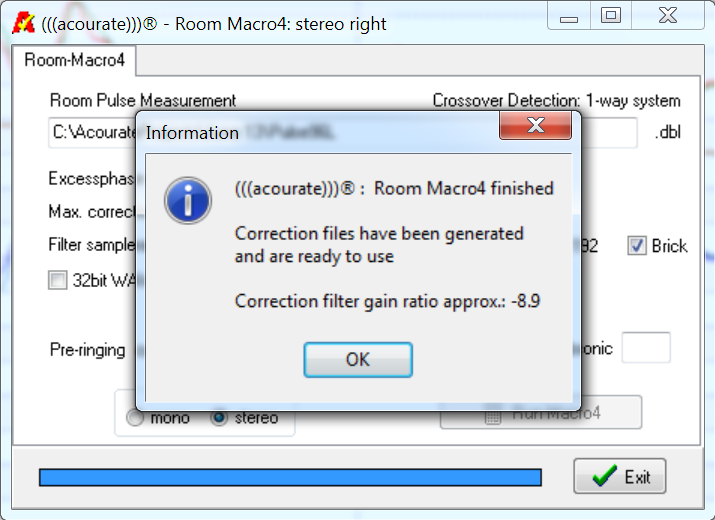
The FIR filters have been generated and stored as wav files in the workspace project directory.
Filter Verification Step – Test Convolution
Here I inspect the frequency and step response of the filter to ensure no anomalies.
From the Room menu, select Macro 5 – Test Convolution:
Click to enlarge
Click yes:
Click to enlarge
Click Ok.
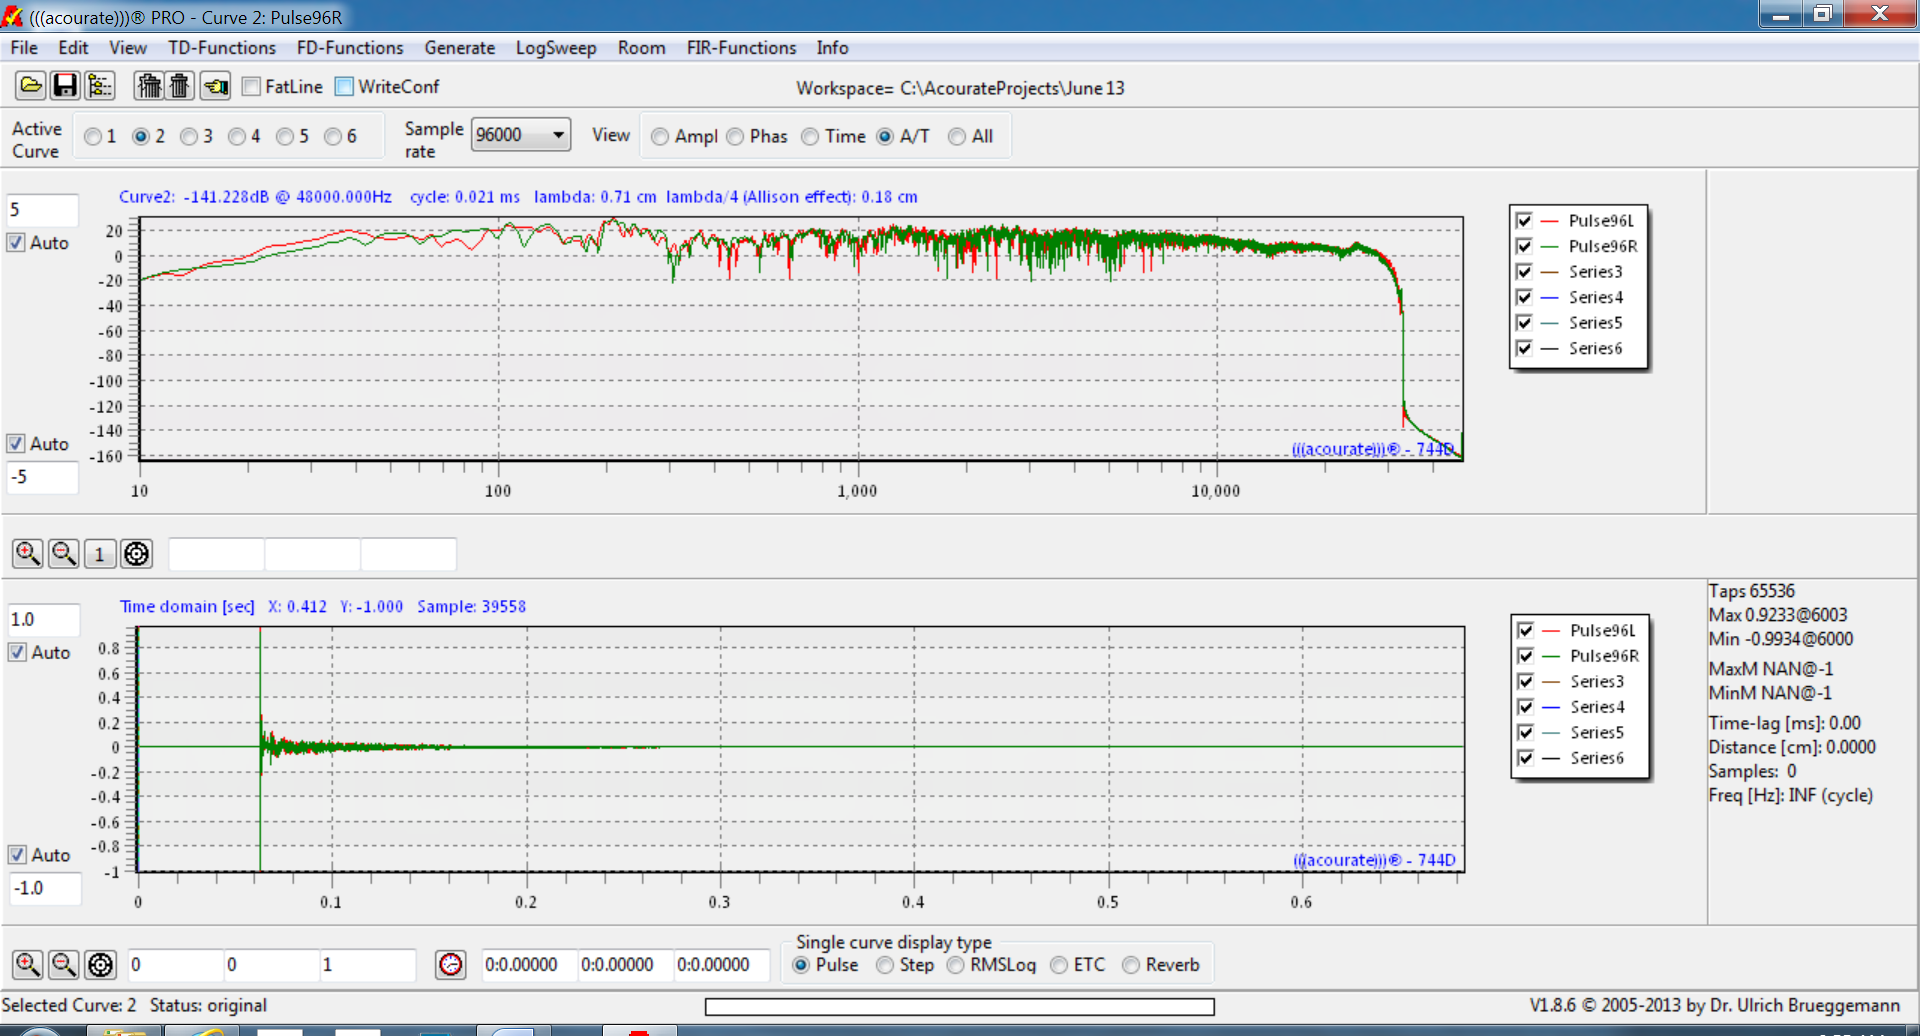
From the toolbar menu, select the Time radio button:
Click to enlarge
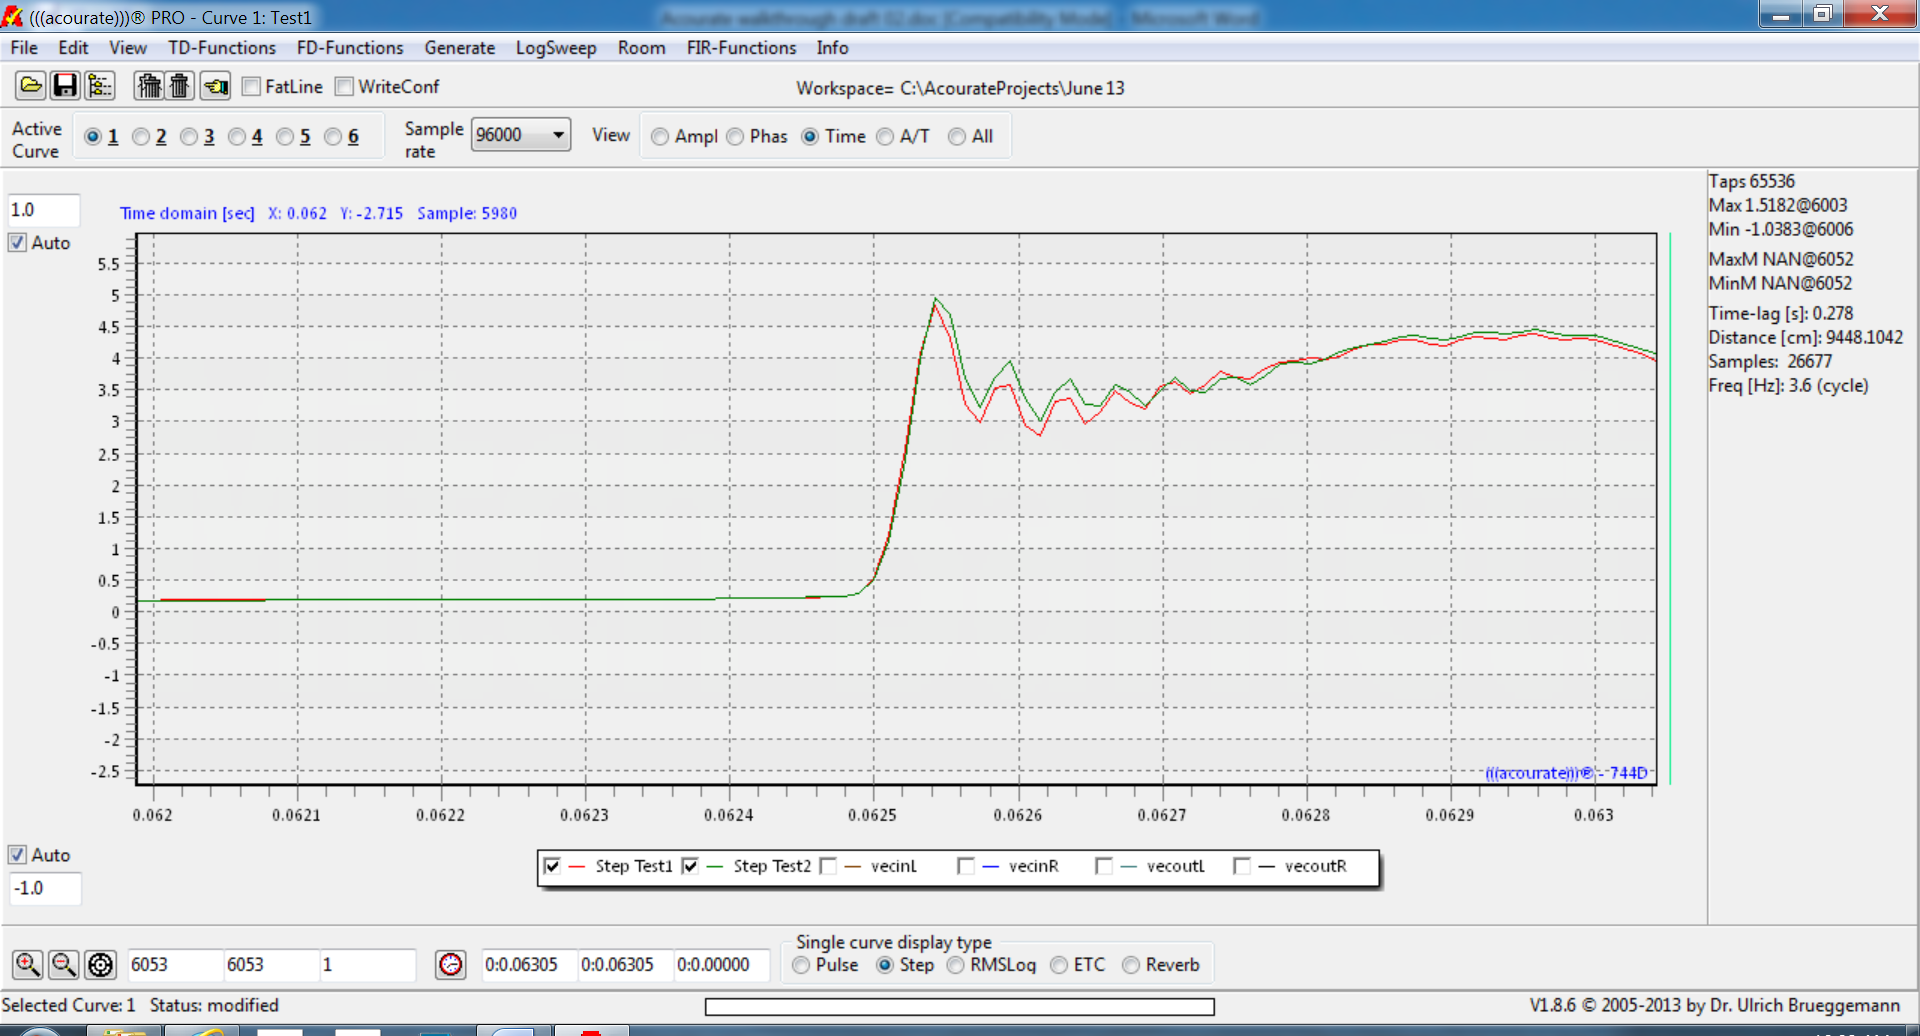
Pretty good step response. Again, a few iterations may be required and details can be found in Uli’s pre-ringing compensation document.
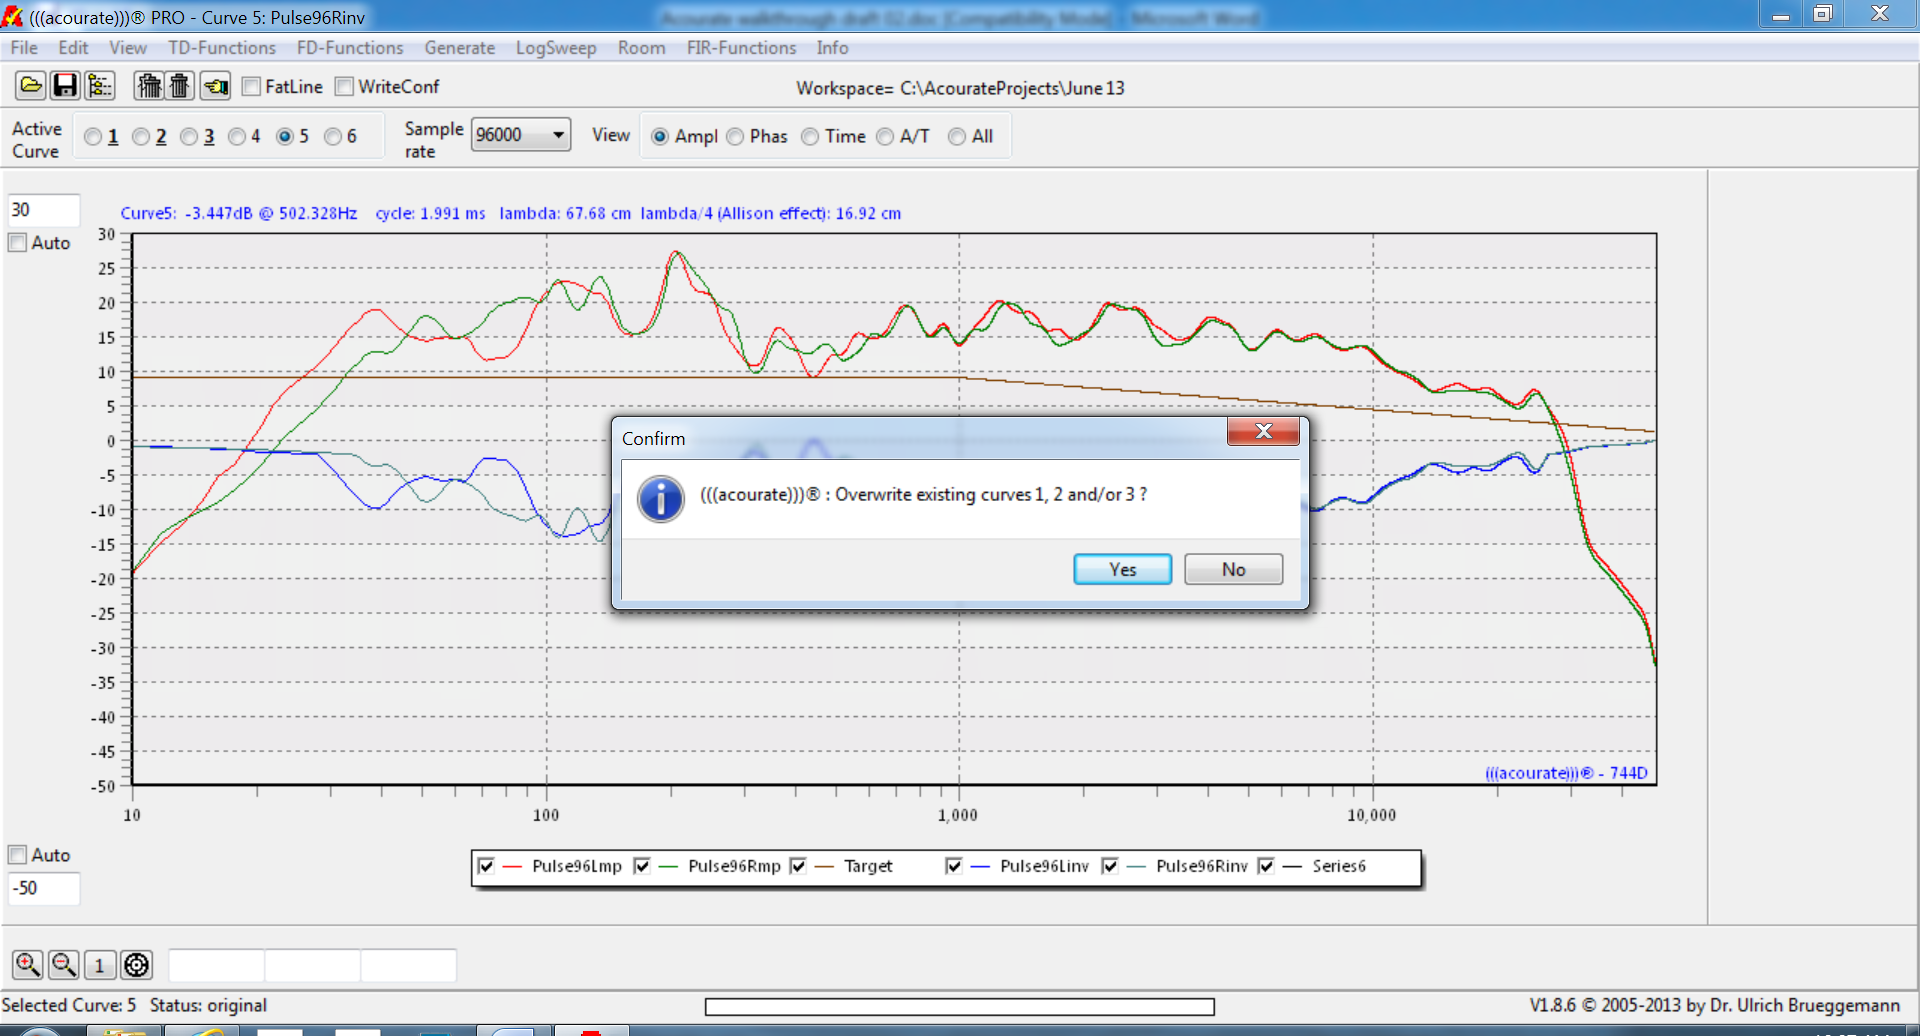
One can also inspect the frequency and phase response of the correction. Here is the frequency response, in which I have run Macro 1 amplitude preparation, (in the TestConvolution directory) so that we can see the psychoacoustic response at the listening position:
Click to enlarge

Note the vertical division is in 2 dB increments. Other than one or two ±2 dB peaks/dips, the response is ±1 dB from 32 Hz to 28 kHz within the perceptually flat target response.
Installing the filter for use:
What is required is a Convolution engine. Acourate has a separate Convolution Engine, along with other complimentary software products such as AcourateNAS. For this report, I used JRiver’s Convolution engine:

The correction filters will automatically switch based on input sample rate.
Ready to listen to music!
Conclusion:
For folks that have never measured their speakers/room before and/or designed a custom finite impulse response (FIR) filter, it can be a bit of a challenging task. However, following the steps here, and after a couple of trial runs, and maybe some assistance from Uli’s knowledgeable and friendly support forum, I can set up, measure, tear down, design and implement the correction filter in under 60 minutes. The results presented here are from my 3rd run.
The reward is a finely tuned musical playback instrument that will bring one closer to the music. Short of a professionally designed and built acoustic listening space, I know of no other way to achieve this level of playback accuracy from speakers in a room.
For me, I am trying to replicate as accurately as possible the music that is stored in the digital media file on disk. For me, transparency is important as I want to hear the music and not the deficiencies in my speakers (not time-aligned or phase coherent) and room (poor room ratio, stereo offset on centerline, firing across short wall).
To my ears, the Acourate correction filters are completely transparent, I cannot hear any pre-ringing or any other digital artifacts like I have heard with other DRC software. There is no compressing of dynamics or any other anomaly that I could detect while listening for several hours.
To my ears, the filters sound correct from a psychoacoustic listening perspective. The spectral balance from top to bottom sounds perceptually flat to my ears. The tone quality or timbre is completely neutral.
With the left and right speaker within ±1 dB tolerance over the frequency range ensures a rock solid image. With the phase corrected, the “right” 3D image is presented at the “right” time (i.e. step response). This phase correction combined with a RFZ provides a level of listening clarity I have not heard before on my system. Almost like wearing headphones, but does not sound “in the head”.
To my ears, the bass response of the speakers in my room has never sounded tighter. The low bass is there, but does not suffer the “single note” bass sound of my badly proportioned room. Nor does it sound boomy or muddy. It sounds similar to the headphone experience of tight, clearly defined bass. Every room will have a resonant frequency (with peaks and dips) that is largely determined by the room’s physical dimensions. To find a rooms Schroeder frequency, and other important acoustic SQ parameters, enter in the rooms dimensions.
Acourate excels in smoothing out the “boxy” sound present in virtually every listening room. Just hearing the “coke bottle” effect or “one note” bass resonance gone is worth the price of Acourate alone.
This article just scratches the surface of Uli’s high end audio toolbox. On my to-do list is to tri-amp my speakers using Acourate’s high quality linear phase digital crossovers.
I am very impressed with Acourate. Bottom line, I hear more music and less room. For the money, I can’t think of a single upgrade to any music playback system that has this level of audible and measurable sound quality improvement.
Highly recommended.
![]()
 Next Steps:
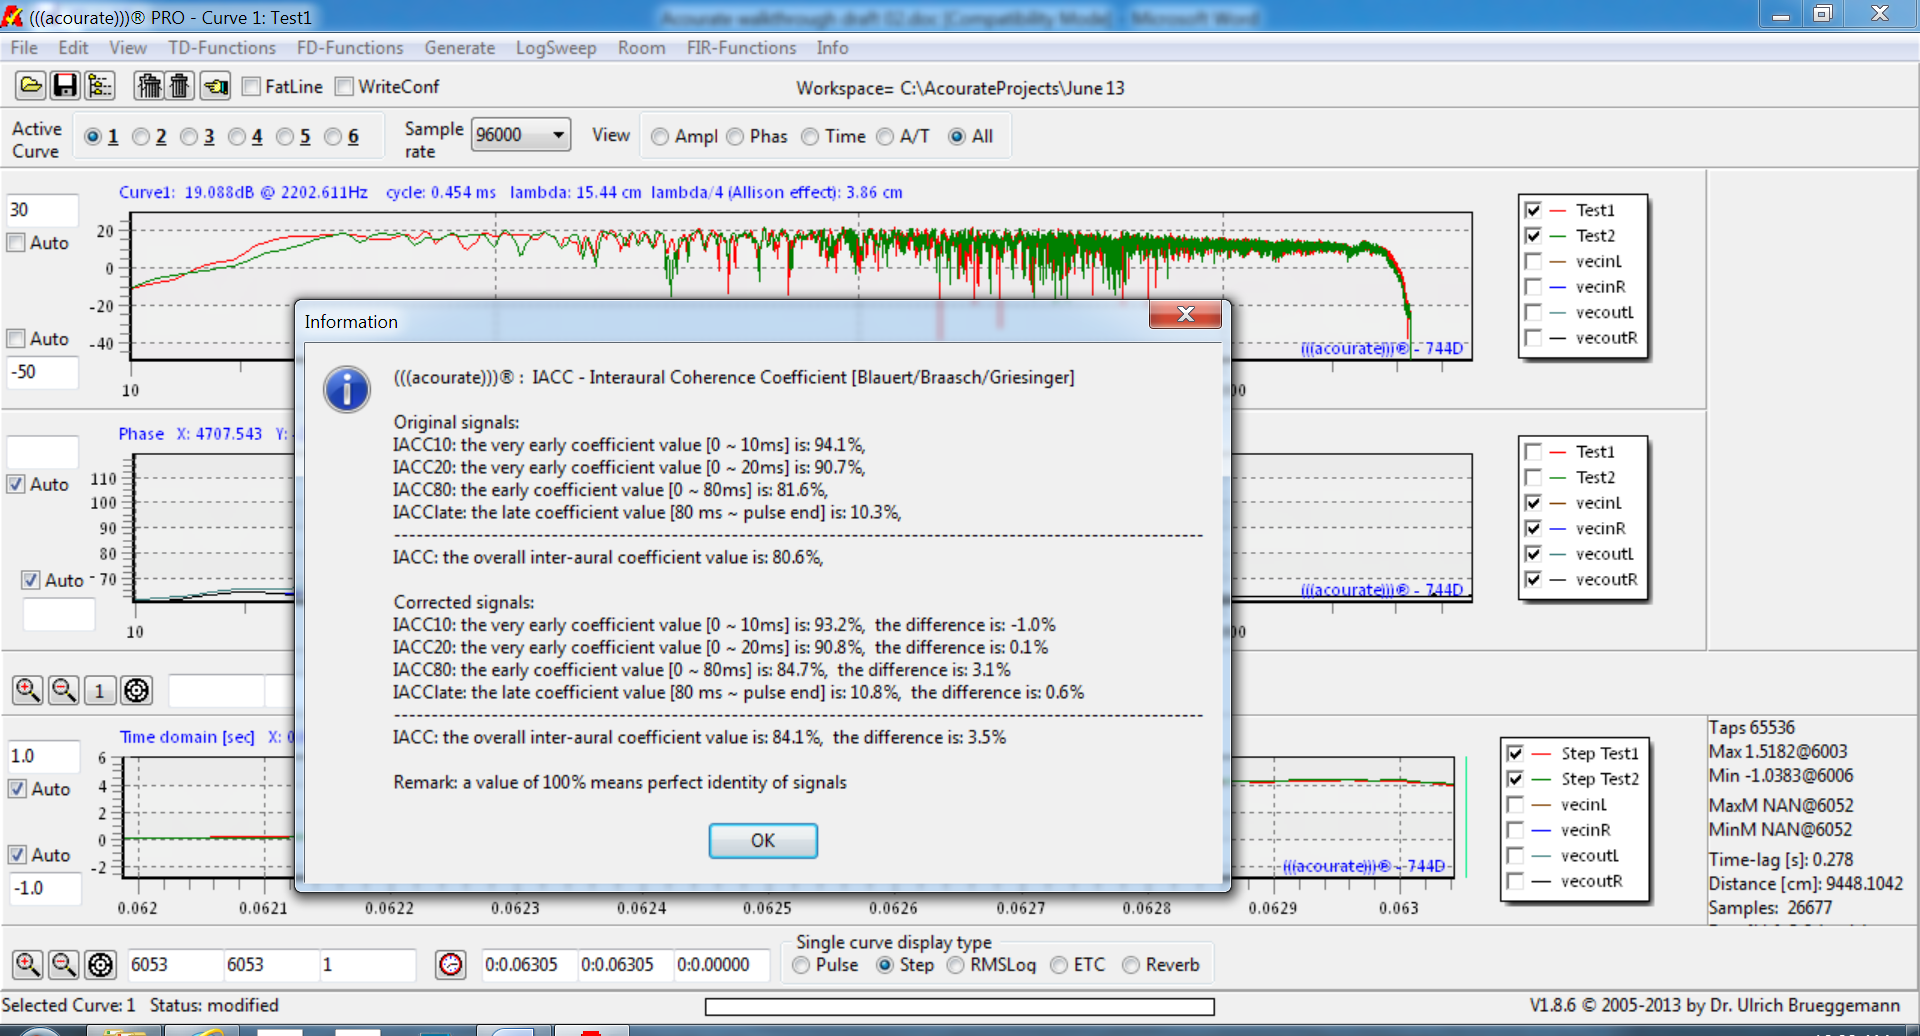
As I mentioned in my previous article, I plan on using these binaural microphones to record the before and after correction, so folks can hear the improvement made on my system.
Further, I am going to use difference testing to see how close the sound arriving at my ears is compared to the music stored in the digital media file on disk.
Until then, enjoy the music!
Link to Part II - > Advanced Acourate Digital XO Time Alignment Driver Linearization Walkthrough
![]()
![]()
About the author
 Mitch “Mitchco” Barnett
I love music and audio. I grew up with music around me as my Mom was a piano player (swing) and my Dad was an audiophile (jazz). At that time Heathkit was big and my Dad and I built several of their audio kits. Electronics was my first career and my hobby was building speakers, amps, preamps, etc., and I still DIY today ![]() . I also mixed live sound for a variety of bands, which led to an opportunity to work full-time in a 24 track recording studio. Over 10 years, I recorded, mixed, and sometimes produced
. I also mixed live sound for a variety of bands, which led to an opportunity to work full-time in a 24 track recording studio. Over 10 years, I recorded, mixed, and sometimes produced ![]() over 30 albums, 100 jingles, and several audio for video post productions in a number of recording studios in Western Canada. This was during a time when analog was going digital and I worked in the first 48 track all digital studio in Canada. Along the way, I partnered with some like-minded audiophile friends, and opened up an acoustic consulting and manufacturing company. I purchased a TEF acoustics analysis computer
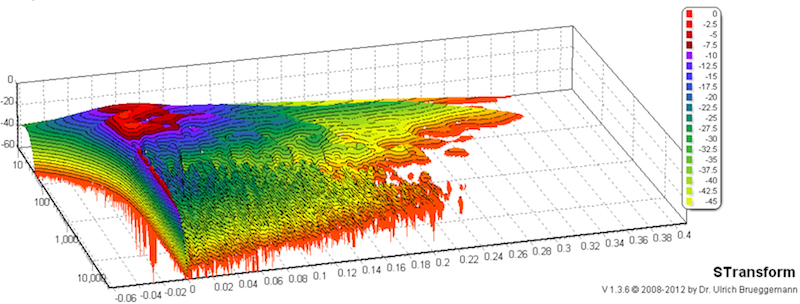
over 30 albums, 100 jingles, and several audio for video post productions in a number of recording studios in Western Canada. This was during a time when analog was going digital and I worked in the first 48 track all digital studio in Canada. Along the way, I partnered with some like-minded audiophile friends, and opened up an acoustic consulting and manufacturing company. I purchased a TEF acoustics analysis computer ![]() which was a revolution in acoustic measuring as it was the first time sound could be measured in 3 dimensions. My interest in software development drove me back to University and I have been designing and developing software
which was a revolution in acoustic measuring as it was the first time sound could be measured in 3 dimensions. My interest in software development drove me back to University and I have been designing and developing software ![]() ever since.
ever since.
![]()
![]()


Recommended Comments
Create an account or sign in to comment
You need to be a member in order to leave a comment
Create an account
Sign up for a new account in our community. It's easy!
Register a new accountSign in
Already have an account? Sign in here.
Sign In Now